Aspergillus avenaceus
Taxonomy: cellular organisms; Eukaryota; Opisthokonta; Fungi; Dikarya; Ascomycota; saccharomyceta; Pezizomycotina; leotiomyceta; Eurotiomycetes; Eurotiomycetidae; Eurotiales; Aspergillaceae; Aspergillus; Aspergillus subgen. Circumdati
Average proteome isoelectric point is 6.44
Get precalculated fractions of proteins

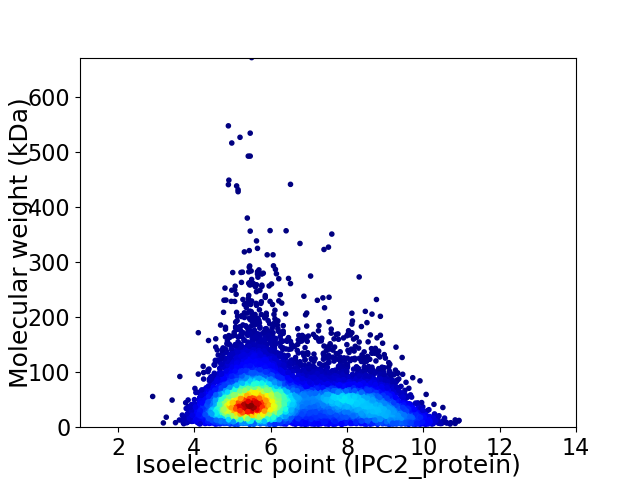
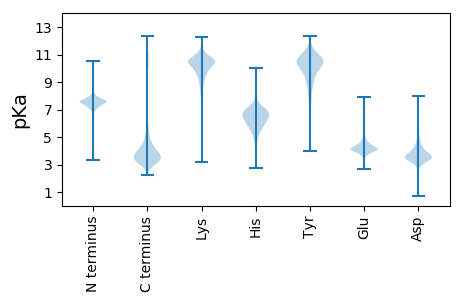
Virtual 2D-PAGE plot for 11290 proteins (isoelectric point calculated using IPC2_protein)
Get csv file with sequences according to given criteria:
* You can choose from 21 different methods for calculating isoelectric point
Summary statistics related to proteome-wise predictions


Protein with the lowest isoelectric point:
>tr|A0A5N6TK27|A0A5N6TK27_9EURO EKC/KEOPS complex subunit CGI121 OS=Aspergillus avenaceus OX=36643 GN=BDV25DRAFT_162447 PE=3 SV=1
MM1 pKa = 7.13HH2 pKa = 7.6TIKK5 pKa = 10.91LLAFSGLMLMSSAIGAEE22 pKa = 4.34LDD24 pKa = 3.76RR25 pKa = 11.84DD26 pKa = 4.05DD27 pKa = 4.88VPNRR31 pKa = 11.84CWDD34 pKa = 3.12VCGPVVGIAHH44 pKa = 7.05KK45 pKa = 10.45CDD47 pKa = 2.96GMHH50 pKa = 7.39DD51 pKa = 3.72SDD53 pKa = 4.11RR54 pKa = 11.84AEE56 pKa = 4.27MNCICDD62 pKa = 3.54WKK64 pKa = 10.35QAPSLIPLCEE74 pKa = 3.75ACIAQYY80 pKa = 10.43RR81 pKa = 11.84SEE83 pKa = 4.09RR84 pKa = 11.84NQRR87 pKa = 11.84NRR89 pKa = 11.84DD90 pKa = 3.71DD91 pKa = 6.33DD92 pKa = 6.3DD93 pKa = 7.57DD94 pKa = 7.29DD95 pKa = 7.65DD96 pKa = 7.58DD97 pKa = 7.43DD98 pKa = 6.68DD99 pKa = 5.92DD100 pKa = 6.22HH101 pKa = 7.73DD102 pKa = 4.12PHH104 pKa = 8.73DD105 pKa = 4.17NDD107 pKa = 5.09AYY109 pKa = 10.86DD110 pKa = 3.77ILTSCSLSTTSYY122 pKa = 10.79NPTAASSAVSSASATGNASATDD144 pKa = 3.63ATSTSTATGSVSNSPVSDD162 pKa = 3.56SASTSNTNSANNAQTTDD179 pKa = 3.27NAASSFSSPASASLAAVVGLGFLAWLL205 pKa = 4.18
MM1 pKa = 7.13HH2 pKa = 7.6TIKK5 pKa = 10.91LLAFSGLMLMSSAIGAEE22 pKa = 4.34LDD24 pKa = 3.76RR25 pKa = 11.84DD26 pKa = 4.05DD27 pKa = 4.88VPNRR31 pKa = 11.84CWDD34 pKa = 3.12VCGPVVGIAHH44 pKa = 7.05KK45 pKa = 10.45CDD47 pKa = 2.96GMHH50 pKa = 7.39DD51 pKa = 3.72SDD53 pKa = 4.11RR54 pKa = 11.84AEE56 pKa = 4.27MNCICDD62 pKa = 3.54WKK64 pKa = 10.35QAPSLIPLCEE74 pKa = 3.75ACIAQYY80 pKa = 10.43RR81 pKa = 11.84SEE83 pKa = 4.09RR84 pKa = 11.84NQRR87 pKa = 11.84NRR89 pKa = 11.84DD90 pKa = 3.71DD91 pKa = 6.33DD92 pKa = 6.3DD93 pKa = 7.57DD94 pKa = 7.29DD95 pKa = 7.65DD96 pKa = 7.58DD97 pKa = 7.43DD98 pKa = 6.68DD99 pKa = 5.92DD100 pKa = 6.22HH101 pKa = 7.73DD102 pKa = 4.12PHH104 pKa = 8.73DD105 pKa = 4.17NDD107 pKa = 5.09AYY109 pKa = 10.86DD110 pKa = 3.77ILTSCSLSTTSYY122 pKa = 10.79NPTAASSAVSSASATGNASATDD144 pKa = 3.63ATSTSTATGSVSNSPVSDD162 pKa = 3.56SASTSNTNSANNAQTTDD179 pKa = 3.27NAASSFSSPASASLAAVVGLGFLAWLL205 pKa = 4.18
Molecular weight: 21.4 kDa
Isoelectric point according different methods:
Protein with the highest isoelectric point:
>tr|A0A5N6U7K7|A0A5N6U7K7_9EURO Chaperonin 10-like protein OS=Aspergillus avenaceus OX=36643 GN=BDV25DRAFT_147490 PE=4 SV=1
MM1 pKa = 6.63TTRR4 pKa = 11.84TPRR7 pKa = 11.84PPTGMPTPIPRR18 pKa = 11.84PPRR21 pKa = 11.84PPATEE26 pKa = 3.83AHH28 pKa = 6.93PPTPPHH34 pKa = 6.94LPIQTLRR41 pKa = 11.84TRR43 pKa = 11.84LRR45 pKa = 11.84LPTPAPRR52 pKa = 11.84PTQAPPTAPPPTPTPRR68 pKa = 11.84PTVVRR73 pKa = 11.84LPTALRR79 pKa = 11.84LTAVTLPAPITAVTLMHH96 pKa = 6.89PRR98 pKa = 11.84PPVNVQQ104 pKa = 2.65
MM1 pKa = 6.63TTRR4 pKa = 11.84TPRR7 pKa = 11.84PPTGMPTPIPRR18 pKa = 11.84PPRR21 pKa = 11.84PPATEE26 pKa = 3.83AHH28 pKa = 6.93PPTPPHH34 pKa = 6.94LPIQTLRR41 pKa = 11.84TRR43 pKa = 11.84LRR45 pKa = 11.84LPTPAPRR52 pKa = 11.84PTQAPPTAPPPTPTPRR68 pKa = 11.84PTVVRR73 pKa = 11.84LPTALRR79 pKa = 11.84LTAVTLPAPITAVTLMHH96 pKa = 6.89PRR98 pKa = 11.84PPVNVQQ104 pKa = 2.65
Molecular weight: 11.2 kDa
Isoelectric point according different methods:
Peptides (in silico digests for buttom-up proteomics)
Below you can find in silico digests of the whole proteome with Trypsin, Chymotrypsin, Trypsin+LysC, LysN, ArgC proteases suitable for different mass spec machines.| Try ESI |
 |
|---|
| ChTry ESI |
 |
|---|
| ArgC ESI |
 |
|---|
| LysN ESI |
 |
|---|
| TryLysC ESI |
 |
|---|
| Try MALDI |
 |
|---|
| ChTry MALDI |
 |
|---|
| ArgC MALDI |
 |
|---|
| LysN MALDI |
 |
|---|
| TryLysC MALDI |
 |
|---|
| Try LTQ |
 |
|---|
| ChTry LTQ |
 |
|---|
| ArgC LTQ |
 |
|---|
| LysN LTQ |
 |
|---|
| TryLysC LTQ |
 |
|---|
| Try MSlow |
 |
|---|
| ChTry MSlow |
 |
|---|
| ArgC MSlow |
 |
|---|
| LysN MSlow |
 |
|---|
| TryLysC MSlow |
 |
|---|
| Try MShigh |
 |
|---|
| ChTry MShigh |
 |
|---|
| ArgC MShigh |
 |
|---|
| LysN MShigh |
 |
|---|
| TryLysC MShigh |
 |
|---|
General Statistics
Number of major isoforms |
Number of additional isoforms |
Number of all proteins |
Number of amino acids |
Min. Seq. Length |
Max. Seq. Length |
Avg. Seq. Length |
Avg. Mol. Weight |
|---|---|---|---|---|---|---|---|
0 |
5386922 |
49 |
6023 |
477.1 |
52.96 |
Amino acid frequency
Ala |
Cys |
Asp |
Glu |
Phe |
Gly |
His |
Ile |
Lys |
Leu |
|---|---|---|---|---|---|---|---|---|---|
8.153 ± 0.017 | 1.342 ± 0.011 |
5.663 ± 0.014 | 6.036 ± 0.023 |
3.838 ± 0.014 | 6.766 ± 0.024 |
2.475 ± 0.01 | 5.057 ± 0.017 |
4.577 ± 0.021 | 9.138 ± 0.025 |
Met |
Asn |
Gln |
Pro |
Arg |
Ser |
Thr |
Val |
Trp |
Tyr |
|---|---|---|---|---|---|---|---|---|---|
2.199 ± 0.008 | 3.716 ± 0.011 |
5.952 ± 0.026 | 4.018 ± 0.016 |
6.093 ± 0.021 | 8.29 ± 0.025 |
5.966 ± 0.014 | 6.281 ± 0.019 |
1.502 ± 0.008 | 2.938 ± 0.011 |
Most of the basic statistics you can see at this page can be downloaded from this CSV file
Proteome-pI is available under Creative Commons Attribution-NoDerivs license, for more details see here
| Reference: Kozlowski LP. Proteome-pI 2.0: Proteome Isoelectric Point Database Update. Nucleic Acids Res. 2021, doi: 10.1093/nar/gkab944 | Contact: Lukasz P. Kozlowski |
