Colletotrichum graminicola (strain M1.001 / M2 / FGSC 10212) (Maize anthracnose fungus) (Glomerella graminicola)
Taxonomy: cellular organisms; Eukaryota; Opisthokonta; Fungi; Dikarya; Ascomycota; saccharomyceta; Pezizomycotina; leotiomyceta; sordariomyceta; Sordariomycetes; Hypocreomycetidae; Glomerellales; Glomerellaceae; Colletotrichum; Colletotrichum graminicola species complex; Colletotrichum graminicola
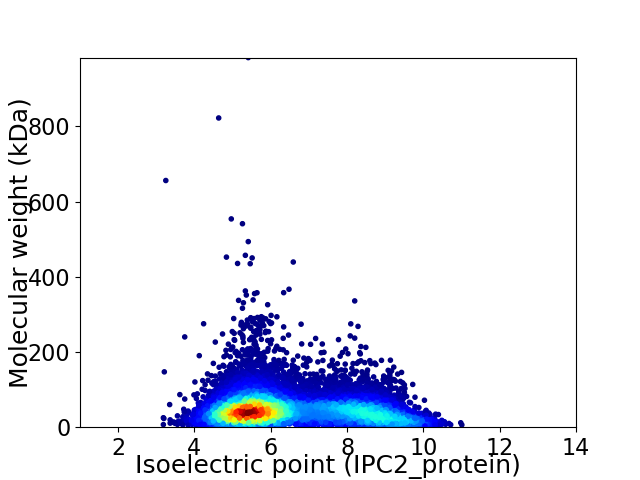
Average proteome isoelectric point is 6.52
Get precalculated fractions of proteins

Virtual 2D-PAGE plot for 12019 proteins (isoelectric point calculated using IPC2_protein)
Get csv file with sequences according to given criteria:
* You can choose from 21 different methods for calculating isoelectric point
Summary statistics related to proteome-wise predictions


Protein with the lowest isoelectric point:
>tr|E3QHW1|E3QHW1_COLGM Major facilitator superfamily transporter OS=Colletotrichum graminicola (strain M1.001 / M2 / FGSC 10212) OX=645133 GN=GLRG_05593 PE=4 SV=1
MM1 pKa = 7.75SLGEE5 pKa = 4.5CSNICKK11 pKa = 10.44ANPQCLSFQFTDD23 pKa = 3.46YY24 pKa = 11.41GRR26 pKa = 11.84GEE28 pKa = 4.1MACYY32 pKa = 9.36TFNLPAAAAIVPDD45 pKa = 4.34TANSPDD51 pKa = 4.18PEE53 pKa = 4.97PEE55 pKa = 3.69SDD57 pKa = 4.32ADD59 pKa = 3.68ADD61 pKa = 4.44LFNTNLDD68 pKa = 3.82TNLDD72 pKa = 3.63ADD74 pKa = 5.01LDD76 pKa = 4.24ADD78 pKa = 5.01LDD80 pKa = 4.32ANLDD84 pKa = 3.51ADD86 pKa = 4.32PNHH89 pKa = 6.82RR90 pKa = 11.84PSPNLWRR97 pKa = 11.84DD98 pKa = 3.25GLRR101 pKa = 3.57
MM1 pKa = 7.75SLGEE5 pKa = 4.5CSNICKK11 pKa = 10.44ANPQCLSFQFTDD23 pKa = 3.46YY24 pKa = 11.41GRR26 pKa = 11.84GEE28 pKa = 4.1MACYY32 pKa = 9.36TFNLPAAAAIVPDD45 pKa = 4.34TANSPDD51 pKa = 4.18PEE53 pKa = 4.97PEE55 pKa = 3.69SDD57 pKa = 4.32ADD59 pKa = 3.68ADD61 pKa = 4.44LFNTNLDD68 pKa = 3.82TNLDD72 pKa = 3.63ADD74 pKa = 5.01LDD76 pKa = 4.24ADD78 pKa = 5.01LDD80 pKa = 4.32ANLDD84 pKa = 3.51ADD86 pKa = 4.32PNHH89 pKa = 6.82RR90 pKa = 11.84PSPNLWRR97 pKa = 11.84DD98 pKa = 3.25GLRR101 pKa = 3.57
Molecular weight: 10.95 kDa
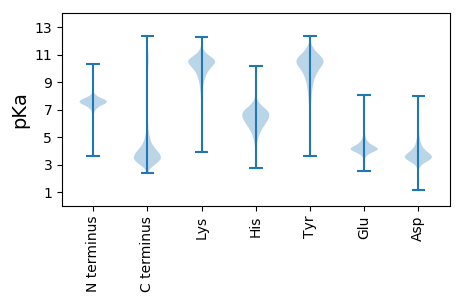
Isoelectric point according different methods:
Protein with the highest isoelectric point:
>tr|E3QD49|E3QD49_COLGM Uncharacterized protein OS=Colletotrichum graminicola (strain M1.001 / M2 / FGSC 10212) OX=645133 GN=GLRG_03965 PE=4 SV=1
MM1 pKa = 7.85PLRR4 pKa = 11.84STRR7 pKa = 11.84HH8 pKa = 3.77TTTAPRR14 pKa = 11.84RR15 pKa = 11.84NGLFSRR21 pKa = 11.84RR22 pKa = 11.84RR23 pKa = 11.84AAPATTTATTRR34 pKa = 11.84TTHH37 pKa = 5.31TKK39 pKa = 10.34RR40 pKa = 11.84GGLFSRR46 pKa = 11.84RR47 pKa = 11.84RR48 pKa = 11.84GPVHH52 pKa = 5.74TAAPVHH58 pKa = 4.94HH59 pKa = 6.95HH60 pKa = 5.97RR61 pKa = 11.84RR62 pKa = 11.84KK63 pKa = 9.97PSMGDD68 pKa = 3.3KK69 pKa = 10.53ISGAMLKK76 pKa = 10.72LKK78 pKa = 9.36GTLTRR83 pKa = 11.84RR84 pKa = 11.84PGQKK88 pKa = 9.9AAGTRR93 pKa = 11.84RR94 pKa = 11.84MHH96 pKa = 5.68GTDD99 pKa = 2.9GRR101 pKa = 11.84GSRR104 pKa = 11.84RR105 pKa = 11.84YY106 pKa = 9.57
MM1 pKa = 7.85PLRR4 pKa = 11.84STRR7 pKa = 11.84HH8 pKa = 3.77TTTAPRR14 pKa = 11.84RR15 pKa = 11.84NGLFSRR21 pKa = 11.84RR22 pKa = 11.84RR23 pKa = 11.84AAPATTTATTRR34 pKa = 11.84TTHH37 pKa = 5.31TKK39 pKa = 10.34RR40 pKa = 11.84GGLFSRR46 pKa = 11.84RR47 pKa = 11.84RR48 pKa = 11.84GPVHH52 pKa = 5.74TAAPVHH58 pKa = 4.94HH59 pKa = 6.95HH60 pKa = 5.97RR61 pKa = 11.84RR62 pKa = 11.84KK63 pKa = 9.97PSMGDD68 pKa = 3.3KK69 pKa = 10.53ISGAMLKK76 pKa = 10.72LKK78 pKa = 9.36GTLTRR83 pKa = 11.84RR84 pKa = 11.84PGQKK88 pKa = 9.9AAGTRR93 pKa = 11.84RR94 pKa = 11.84MHH96 pKa = 5.68GTDD99 pKa = 2.9GRR101 pKa = 11.84GSRR104 pKa = 11.84RR105 pKa = 11.84YY106 pKa = 9.57
Molecular weight: 11.79 kDa
Isoelectric point according different methods:
Peptides (in silico digests for buttom-up proteomics)
Below you can find in silico digests of the whole proteome with Trypsin, Chymotrypsin, Trypsin+LysC, LysN, ArgC proteases suitable for different mass spec machines.| Try ESI |
 |
|---|
| ChTry ESI |
 |
|---|
| ArgC ESI |
 |
|---|
| LysN ESI |
 |
|---|
| TryLysC ESI |
 |
|---|
| Try MALDI |
 |
|---|
| ChTry MALDI |
 |
|---|
| ArgC MALDI |
 |
|---|
| LysN MALDI |
 |
|---|
| TryLysC MALDI |
 |
|---|
| Try LTQ |
 |
|---|
| ChTry LTQ |
 |
|---|
| ArgC LTQ |
 |
|---|
| LysN LTQ |
 |
|---|
| TryLysC LTQ |
 |
|---|
| Try MSlow |
 |
|---|
| ChTry MSlow |
 |
|---|
| ArgC MSlow |
 |
|---|
| LysN MSlow |
 |
|---|
| TryLysC MSlow |
 |
|---|
| Try MShigh |
 |
|---|
| ChTry MShigh |
 |
|---|
| ArgC MShigh |
 |
|---|
| LysN MShigh |
 |
|---|
| TryLysC MShigh |
 |
|---|
General Statistics
Number of major isoforms |
Number of additional isoforms |
Number of all proteins |
Number of amino acids |
Min. Seq. Length |
Max. Seq. Length |
Avg. Seq. Length |
Avg. Mol. Weight |
|---|---|---|---|---|---|---|---|
0 |
5585661 |
31 |
8935 |
464.7 |
51.19 |
Amino acid frequency
Ala |
Cys |
Asp |
Glu |
Phe |
Gly |
His |
Ile |
Lys |
Leu |
|---|---|---|---|---|---|---|---|---|---|
9.286 ± 0.021 | 1.209 ± 0.008 |
5.78 ± 0.017 | 6.024 ± 0.024 |
3.696 ± 0.013 | 7.2 ± 0.023 |
2.31 ± 0.01 | 4.628 ± 0.015 |
4.775 ± 0.024 | 8.687 ± 0.025 |
Met |
Asn |
Gln |
Pro |
Arg |
Ser |
Thr |
Val |
Trp |
Tyr |
|---|---|---|---|---|---|---|---|---|---|
2.232 ± 0.009 | 3.585 ± 0.013 |
6.172 ± 0.029 | 3.888 ± 0.017 |
6.119 ± 0.023 | 7.934 ± 0.026 |
5.915 ± 0.023 | 6.378 ± 0.017 |
1.487 ± 0.008 | 2.696 ± 0.011 |
Most of the basic statistics you can see at this page can be downloaded from this CSV file
Proteome-pI is available under Creative Commons Attribution-NoDerivs license, for more details see here
| Reference: Kozlowski LP. Proteome-pI 2.0: Proteome Isoelectric Point Database Update. Nucleic Acids Res. 2021, doi: 10.1093/nar/gkab944 | Contact: Lukasz P. Kozlowski |
