Buchnera aphidicola (Thelaxes californica)
Taxonomy: cellular organisms; Bacteria; Proteobacteria; Gammaproteobacteria; Enterobacterales; Erwiniaceae; Buchnera; Buchnera aphidicola
Average proteome isoelectric point is 8.49
Get precalculated fractions of proteins

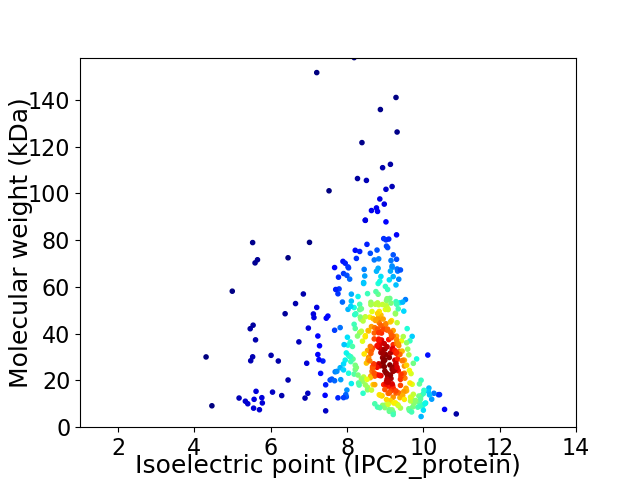
Virtual 2D-PAGE plot for 455 proteins (isoelectric point calculated using IPC2_protein)
Get csv file with sequences according to given criteria:
* You can choose from 21 different methods for calculating isoelectric point
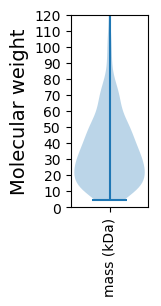
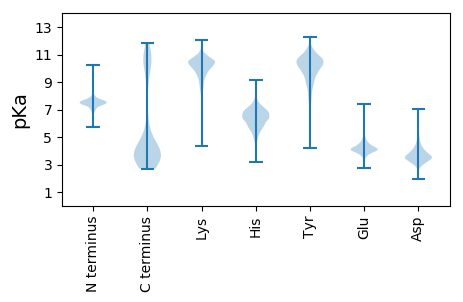
Summary statistics related to proteome-wise predictions


Protein with the lowest isoelectric point:
>tr|A0A4D6YLA5|A0A4D6YLA5_9GAMM Dual-specificity RNA methyltransferase RlmN OS=Buchnera aphidicola (Thelaxes californica) OX=1315998 GN=rlmN PE=3 SV=1
MM1 pKa = 7.23QFEE4 pKa = 4.34EE5 pKa = 4.75KK6 pKa = 10.47KK7 pKa = 10.47IIEE10 pKa = 4.24NLFEE14 pKa = 3.98RR15 pKa = 11.84LKK17 pKa = 10.98NVEE20 pKa = 4.26EE21 pKa = 4.21KK22 pKa = 10.97CPEE25 pKa = 4.12KK26 pKa = 10.45NTLANNFINEE36 pKa = 4.83CIQKK40 pKa = 9.63NPNSIYY46 pKa = 10.72YY47 pKa = 9.93IIQTVLIQEE56 pKa = 4.26DD57 pKa = 4.45VIKK60 pKa = 10.59KK61 pKa = 9.55LNEE64 pKa = 4.0RR65 pKa = 11.84IIALEE70 pKa = 3.7NDD72 pKa = 2.5ISLFKK77 pKa = 10.84KK78 pKa = 10.35NNNIQEE84 pKa = 4.06PSFLKK89 pKa = 9.61NTEE92 pKa = 3.85NAIKK96 pKa = 9.32STQKK100 pKa = 11.06LDD102 pKa = 3.35TKK104 pKa = 10.81KK105 pKa = 10.52NQNTISKK112 pKa = 9.64NYY114 pKa = 10.14DD115 pKa = 3.09SAFYY119 pKa = 9.46EE120 pKa = 4.63QKK122 pKa = 10.89NPMNKK127 pKa = 9.45GCNSSISSGGVSSFLGSAAQTAAGVAGGIFMGNILNNLFHH167 pKa = 7.07SDD169 pKa = 3.9KK170 pKa = 10.77EE171 pKa = 3.87ISTPIDD177 pKa = 3.13INNQNDD183 pKa = 3.32LSKK186 pKa = 10.78ISNTDD191 pKa = 3.31SIKK194 pKa = 10.72KK195 pKa = 10.28VNDD198 pKa = 3.6DD199 pKa = 4.0FLSEE203 pKa = 3.95EE204 pKa = 4.92DD205 pKa = 4.23KK206 pKa = 11.21IQNNEE211 pKa = 4.0NKK213 pKa = 10.19NLDD216 pKa = 3.32HH217 pKa = 7.73DD218 pKa = 4.42YY219 pKa = 11.43EE220 pKa = 4.59NNHH223 pKa = 5.93EE224 pKa = 4.25EE225 pKa = 4.33ANNEE229 pKa = 3.56YY230 pKa = 10.82DD231 pKa = 3.82EE232 pKa = 5.62YY233 pKa = 11.55DD234 pKa = 5.64DD235 pKa = 5.67EE236 pKa = 7.4DD237 pKa = 4.95EE238 pKa = 6.37DD239 pKa = 6.46DD240 pKa = 4.64DD241 pKa = 6.49DD242 pKa = 5.52YY243 pKa = 12.18YY244 pKa = 11.42EE245 pKa = 4.23NHH247 pKa = 7.75DD248 pKa = 5.48DD249 pKa = 5.14NMLDD253 pKa = 3.82IDD255 pKa = 4.06NQGDD259 pKa = 3.62EE260 pKa = 4.48LLL262 pKa = 4.73
MM1 pKa = 7.23QFEE4 pKa = 4.34EE5 pKa = 4.75KK6 pKa = 10.47KK7 pKa = 10.47IIEE10 pKa = 4.24NLFEE14 pKa = 3.98RR15 pKa = 11.84LKK17 pKa = 10.98NVEE20 pKa = 4.26EE21 pKa = 4.21KK22 pKa = 10.97CPEE25 pKa = 4.12KK26 pKa = 10.45NTLANNFINEE36 pKa = 4.83CIQKK40 pKa = 9.63NPNSIYY46 pKa = 10.72YY47 pKa = 9.93IIQTVLIQEE56 pKa = 4.26DD57 pKa = 4.45VIKK60 pKa = 10.59KK61 pKa = 9.55LNEE64 pKa = 4.0RR65 pKa = 11.84IIALEE70 pKa = 3.7NDD72 pKa = 2.5ISLFKK77 pKa = 10.84KK78 pKa = 10.35NNNIQEE84 pKa = 4.06PSFLKK89 pKa = 9.61NTEE92 pKa = 3.85NAIKK96 pKa = 9.32STQKK100 pKa = 11.06LDD102 pKa = 3.35TKK104 pKa = 10.81KK105 pKa = 10.52NQNTISKK112 pKa = 9.64NYY114 pKa = 10.14DD115 pKa = 3.09SAFYY119 pKa = 9.46EE120 pKa = 4.63QKK122 pKa = 10.89NPMNKK127 pKa = 9.45GCNSSISSGGVSSFLGSAAQTAAGVAGGIFMGNILNNLFHH167 pKa = 7.07SDD169 pKa = 3.9KK170 pKa = 10.77EE171 pKa = 3.87ISTPIDD177 pKa = 3.13INNQNDD183 pKa = 3.32LSKK186 pKa = 10.78ISNTDD191 pKa = 3.31SIKK194 pKa = 10.72KK195 pKa = 10.28VNDD198 pKa = 3.6DD199 pKa = 4.0FLSEE203 pKa = 3.95EE204 pKa = 4.92DD205 pKa = 4.23KK206 pKa = 11.21IQNNEE211 pKa = 4.0NKK213 pKa = 10.19NLDD216 pKa = 3.32HH217 pKa = 7.73DD218 pKa = 4.42YY219 pKa = 11.43EE220 pKa = 4.59NNHH223 pKa = 5.93EE224 pKa = 4.25EE225 pKa = 4.33ANNEE229 pKa = 3.56YY230 pKa = 10.82DD231 pKa = 3.82EE232 pKa = 5.62YY233 pKa = 11.55DD234 pKa = 5.64DD235 pKa = 5.67EE236 pKa = 7.4DD237 pKa = 4.95EE238 pKa = 6.37DD239 pKa = 6.46DD240 pKa = 4.64DD241 pKa = 6.49DD242 pKa = 5.52YY243 pKa = 12.18YY244 pKa = 11.42EE245 pKa = 4.23NHH247 pKa = 7.75DD248 pKa = 5.48DD249 pKa = 5.14NMLDD253 pKa = 3.82IDD255 pKa = 4.06NQGDD259 pKa = 3.62EE260 pKa = 4.48LLL262 pKa = 4.73
Molecular weight: 30.04 kDa
Isoelectric point according different methods:
Protein with the highest isoelectric point:
>tr|A0A4D6YJD9|A0A4D6YJD9_9GAMM 50S ribosomal protein L1 OS=Buchnera aphidicola (Thelaxes californica) OX=1315998 GN=rplA PE=3 SV=1
MM1 pKa = 7.45KK2 pKa = 9.58RR3 pKa = 11.84TFQPSLLKK11 pKa = 10.53RR12 pKa = 11.84NRR14 pKa = 11.84LHH16 pKa = 6.97GFRR19 pKa = 11.84SRR21 pKa = 11.84MATKK25 pKa = 10.24NGRR28 pKa = 11.84HH29 pKa = 5.07ILSRR33 pKa = 11.84RR34 pKa = 11.84RR35 pKa = 11.84NKK37 pKa = 10.06CRR39 pKa = 11.84IKK41 pKa = 10.47LTVSSKK47 pKa = 11.07
MM1 pKa = 7.45KK2 pKa = 9.58RR3 pKa = 11.84TFQPSLLKK11 pKa = 10.53RR12 pKa = 11.84NRR14 pKa = 11.84LHH16 pKa = 6.97GFRR19 pKa = 11.84SRR21 pKa = 11.84MATKK25 pKa = 10.24NGRR28 pKa = 11.84HH29 pKa = 5.07ILSRR33 pKa = 11.84RR34 pKa = 11.84RR35 pKa = 11.84NKK37 pKa = 10.06CRR39 pKa = 11.84IKK41 pKa = 10.47LTVSSKK47 pKa = 11.07
Molecular weight: 5.67 kDa
Isoelectric point according different methods:
Peptides (in silico digests for buttom-up proteomics)
Below you can find in silico digests of the whole proteome with Trypsin, Chymotrypsin, Trypsin+LysC, LysN, ArgC proteases suitable for different mass spec machines.| Try ESI |
 |
|---|
| ChTry ESI |
 |
|---|
| ArgC ESI |
 |
|---|
| LysN ESI |
 |
|---|
| TryLysC ESI |
 |
|---|
| Try MALDI |
 |
|---|
| ChTry MALDI |
 |
|---|
| ArgC MALDI |
 |
|---|
| LysN MALDI |
 |
|---|
| TryLysC MALDI |
 |
|---|
| Try LTQ |
 |
|---|
| ChTry LTQ |
 |
|---|
| ArgC LTQ |
 |
|---|
| LysN LTQ |
 |
|---|
| TryLysC LTQ |
 |
|---|
| Try MSlow |
 |
|---|
| ChTry MSlow |
 |
|---|
| ArgC MSlow |
 |
|---|
| LysN MSlow |
 |
|---|
| TryLysC MSlow |
 |
|---|
| Try MShigh |
 |
|---|
| ChTry MShigh |
 |
|---|
| ArgC MShigh |
 |
|---|
| LysN MShigh |
 |
|---|
| TryLysC MShigh |
 |
|---|
General Statistics
Number of major isoforms |
Number of additional isoforms |
Number of all proteins |
Number of amino acids |
Min. Seq. Length |
Max. Seq. Length |
Avg. Seq. Length |
Avg. Mol. Weight |
|---|---|---|---|---|---|---|---|
0 |
147751 |
38 |
1415 |
324.7 |
37.34 |
Amino acid frequency
Ala |
Cys |
Asp |
Glu |
Phe |
Gly |
His |
Ile |
Lys |
Leu |
|---|---|---|---|---|---|---|---|---|---|
3.907 ± 0.102 | 1.346 ± 0.039 |
3.894 ± 0.078 | 4.91 ± 0.102 |
5.247 ± 0.111 | 5.015 ± 0.112 |
2.355 ± 0.047 | 12.648 ± 0.126 |
10.704 ± 0.161 | 9.519 ± 0.088 |
Met |
Asn |
Gln |
Pro |
Arg |
Ser |
Thr |
Val |
Trp |
Tyr |
|---|---|---|---|---|---|---|---|---|---|
2.246 ± 0.048 | 7.858 ± 0.133 |
2.898 ± 0.052 | 3.794 ± 0.065 |
3.034 ± 0.092 | 6.464 ± 0.076 |
4.775 ± 0.06 | 4.625 ± 0.095 |
0.84 ± 0.044 | 3.923 ± 0.074 |
Most of the basic statistics you can see at this page can be downloaded from this CSV file
Proteome-pI is available under Creative Commons Attribution-NoDerivs license, for more details see here
| Reference: Kozlowski LP. Proteome-pI 2.0: Proteome Isoelectric Point Database Update. Nucleic Acids Res. 2021, doi: 10.1093/nar/gkab944 | Contact: Lukasz P. Kozlowski |
