Arthrobotrys oligospora (strain ATCC 24927 / CBS 115.81 / DSM 1491) (Nematode-trapping fungus) (Didymozoophaga oligospora)
Taxonomy: cellular organisms; Eukaryota; Opisthokonta; Fungi; Dikarya; Ascomycota; saccharomyceta; Pezizomycotina; Orbiliomycetes; Orbiliales; Orbiliaceae; Orbilia; Orbilia oligospora
Average proteome isoelectric point is 6.47
Get precalculated fractions of proteins

Virtual 2D-PAGE plot for 11478 proteins (isoelectric point calculated using IPC2_protein)
Get csv file with sequences according to given criteria:
* You can choose from 21 different methods for calculating isoelectric point
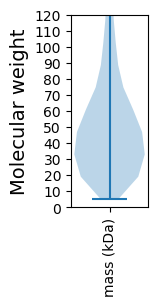
Summary statistics related to proteome-wise predictions


Protein with the lowest isoelectric point:
>tr|G1XPG7|G1XPG7_ARTOA Uncharacterized protein OS=Arthrobotrys oligospora (strain ATCC 24927 / CBS 115.81 / DSM 1491) OX=756982 GN=AOL_s00173g335 PE=4 SV=1
MM1 pKa = 7.46LRR3 pKa = 11.84LILSSLLVLGAAAVPAAKK21 pKa = 9.93EE22 pKa = 3.66LSEE25 pKa = 4.25RR26 pKa = 11.84QLPTYY31 pKa = 7.04TLKK34 pKa = 9.75VTGSGIAADD43 pKa = 3.98TFLKK47 pKa = 9.14ITEE50 pKa = 4.18VDD52 pKa = 3.25GTNYY56 pKa = 10.23VGLVPSTDD64 pKa = 3.14ASTFSYY70 pKa = 10.92DD71 pKa = 3.09AATSEE76 pKa = 4.61LSAVDD81 pKa = 3.86DD82 pKa = 4.09AAVTLFSQSFLNQGDD97 pKa = 4.16VYY99 pKa = 10.7EE100 pKa = 4.32EE101 pKa = 4.25TPAPVSFRR109 pKa = 11.84NEE111 pKa = 3.32TDD113 pKa = 2.78INGCVDD119 pKa = 3.29TNEE122 pKa = 4.9CGFEE126 pKa = 4.08SWTLDD131 pKa = 3.7PASGALGVVRR141 pKa = 11.84TTSPNLYY148 pKa = 10.18ACDD151 pKa = 5.1DD152 pKa = 3.91GAQYY156 pKa = 10.93LLWIGPTTWVTTFCTPISLSAVV178 pKa = 3.33
MM1 pKa = 7.46LRR3 pKa = 11.84LILSSLLVLGAAAVPAAKK21 pKa = 9.93EE22 pKa = 3.66LSEE25 pKa = 4.25RR26 pKa = 11.84QLPTYY31 pKa = 7.04TLKK34 pKa = 9.75VTGSGIAADD43 pKa = 3.98TFLKK47 pKa = 9.14ITEE50 pKa = 4.18VDD52 pKa = 3.25GTNYY56 pKa = 10.23VGLVPSTDD64 pKa = 3.14ASTFSYY70 pKa = 10.92DD71 pKa = 3.09AATSEE76 pKa = 4.61LSAVDD81 pKa = 3.86DD82 pKa = 4.09AAVTLFSQSFLNQGDD97 pKa = 4.16VYY99 pKa = 10.7EE100 pKa = 4.32EE101 pKa = 4.25TPAPVSFRR109 pKa = 11.84NEE111 pKa = 3.32TDD113 pKa = 2.78INGCVDD119 pKa = 3.29TNEE122 pKa = 4.9CGFEE126 pKa = 4.08SWTLDD131 pKa = 3.7PASGALGVVRR141 pKa = 11.84TTSPNLYY148 pKa = 10.18ACDD151 pKa = 5.1DD152 pKa = 3.91GAQYY156 pKa = 10.93LLWIGPTTWVTTFCTPISLSAVV178 pKa = 3.33
Molecular weight: 18.82 kDa
Isoelectric point according different methods:
Protein with the highest isoelectric point:
>tr|G1X9U8|G1X9U8_ARTOA F-box domain-containing protein OS=Arthrobotrys oligospora (strain ATCC 24927 / CBS 115.81 / DSM 1491) OX=756982 GN=AOL_s00076g437 PE=4 SV=1
MM1 pKa = 7.74TILTLLRR8 pKa = 11.84RR9 pKa = 11.84PAISCLRR16 pKa = 11.84STASSSSRR24 pKa = 11.84RR25 pKa = 11.84TFTSLLRR32 pKa = 11.84TPTTIITLQTRR43 pKa = 11.84PTLHH47 pKa = 6.8SSPTSLIPQTTSSTSQTTSTSLLLPLQGLTQTRR80 pKa = 11.84GHH82 pKa = 6.29RR83 pKa = 11.84RR84 pKa = 11.84KK85 pKa = 8.38TYY87 pKa = 8.98NPSHH91 pKa = 7.03IVRR94 pKa = 11.84KK95 pKa = 9.74RR96 pKa = 11.84RR97 pKa = 11.84FGFLARR103 pKa = 11.84LRR105 pKa = 11.84SKK107 pKa = 9.3TGKK110 pKa = 10.27NILKK114 pKa = 9.96RR115 pKa = 11.84RR116 pKa = 11.84KK117 pKa = 9.1AKK119 pKa = 8.97GRR121 pKa = 11.84KK122 pKa = 8.03MLTHH126 pKa = 7.27
MM1 pKa = 7.74TILTLLRR8 pKa = 11.84RR9 pKa = 11.84PAISCLRR16 pKa = 11.84STASSSSRR24 pKa = 11.84RR25 pKa = 11.84TFTSLLRR32 pKa = 11.84TPTTIITLQTRR43 pKa = 11.84PTLHH47 pKa = 6.8SSPTSLIPQTTSSTSQTTSTSLLLPLQGLTQTRR80 pKa = 11.84GHH82 pKa = 6.29RR83 pKa = 11.84RR84 pKa = 11.84KK85 pKa = 8.38TYY87 pKa = 8.98NPSHH91 pKa = 7.03IVRR94 pKa = 11.84KK95 pKa = 9.74RR96 pKa = 11.84RR97 pKa = 11.84FGFLARR103 pKa = 11.84LRR105 pKa = 11.84SKK107 pKa = 9.3TGKK110 pKa = 10.27NILKK114 pKa = 9.96RR115 pKa = 11.84RR116 pKa = 11.84KK117 pKa = 9.1AKK119 pKa = 8.97GRR121 pKa = 11.84KK122 pKa = 8.03MLTHH126 pKa = 7.27
Molecular weight: 14.23 kDa
Isoelectric point according different methods:
Peptides (in silico digests for buttom-up proteomics)
Below you can find in silico digests of the whole proteome with Trypsin, Chymotrypsin, Trypsin+LysC, LysN, ArgC proteases suitable for different mass spec machines.| Try ESI |
 |
|---|
| ChTry ESI |
 |
|---|
| ArgC ESI |
 |
|---|
| LysN ESI |
 |
|---|
| TryLysC ESI |
 |
|---|
| Try MALDI |
 |
|---|
| ChTry MALDI |
 |
|---|
| ArgC MALDI |
 |
|---|
| LysN MALDI |
 |
|---|
| TryLysC MALDI |
 |
|---|
| Try LTQ |
 |
|---|
| ChTry LTQ |
 |
|---|
| ArgC LTQ |
 |
|---|
| LysN LTQ |
 |
|---|
| TryLysC LTQ |
 |
|---|
| Try MSlow |
 |
|---|
| ChTry MSlow |
 |
|---|
| ArgC MSlow |
 |
|---|
| LysN MSlow |
 |
|---|
| TryLysC MSlow |
 |
|---|
| Try MShigh |
 |
|---|
| ChTry MShigh |
 |
|---|
| ArgC MShigh |
 |
|---|
| LysN MShigh |
 |
|---|
| TryLysC MShigh |
 |
|---|
General Statistics
Number of major isoforms |
Number of additional isoforms |
Number of all proteins |
Number of amino acids |
Min. Seq. Length |
Max. Seq. Length |
Avg. Seq. Length |
Avg. Mol. Weight |
|---|---|---|---|---|---|---|---|
0 |
5722854 |
49 |
12515 |
498.6 |
55.34 |
Amino acid frequency
Ala |
Cys |
Asp |
Glu |
Phe |
Gly |
His |
Ile |
Lys |
Leu |
|---|---|---|---|---|---|---|---|---|---|
7.544 ± 0.022 | 1.21 ± 0.009 |
5.649 ± 0.015 | 6.632 ± 0.027 |
3.725 ± 0.015 | 6.843 ± 0.022 |
2.179 ± 0.009 | 5.42 ± 0.017 |
5.543 ± 0.021 | 8.53 ± 0.024 |
Met |
Asn |
Gln |
Pro |
Arg |
Ser |
Thr |
Val |
Trp |
Tyr |
|---|---|---|---|---|---|---|---|---|---|
2.019 ± 0.009 | 4.093 ± 0.013 |
6.176 ± 0.027 | 3.822 ± 0.018 |
5.768 ± 0.019 | 8.351 ± 0.028 |
6.337 ± 0.026 | 5.881 ± 0.017 |
1.363 ± 0.009 | 2.915 ± 0.012 |
Most of the basic statistics you can see at this page can be downloaded from this CSV file
Proteome-pI is available under Creative Commons Attribution-NoDerivs license, for more details see here
| Reference: Kozlowski LP. Proteome-pI 2.0: Proteome Isoelectric Point Database Update. Nucleic Acids Res. 2021, doi: 10.1093/nar/gkab944 | Contact: Lukasz P. Kozlowski |
