Cotia virus
Taxonomy: Viruses; Varidnaviria; Bamfordvirae; Nucleocytoviricota; Pokkesviricetes; Chitovirales; Poxviridae; Chordopoxvirinae; Oryzopoxvirus
Average proteome isoelectric point is 6.97
Get precalculated fractions of proteins

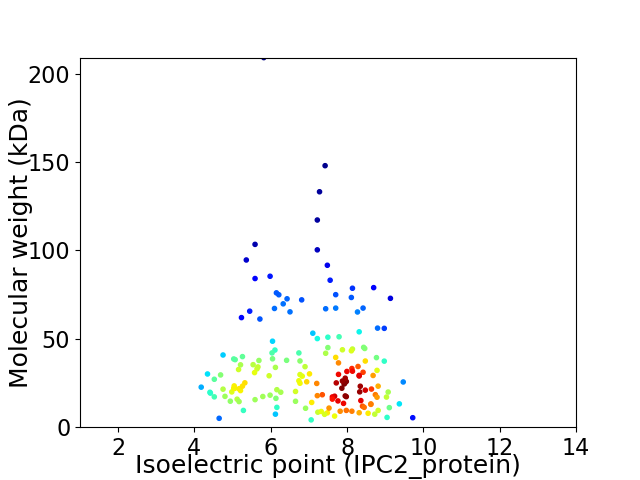
Virtual 2D-PAGE plot for 170 proteins (isoelectric point calculated using IPC2_protein)
Get csv file with sequences according to given criteria:
* You can choose from 21 different methods for calculating isoelectric point
Summary statistics related to proteome-wise predictions


Protein with the lowest isoelectric point:
>tr|A0A097IW10|A0A097IW10_9POXV CD47-like protein OS=Cotia virus OX=39444 GN=146 PE=4 SV=1
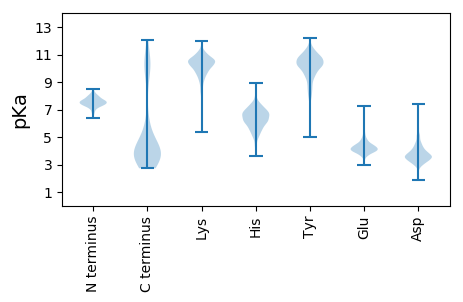
MM1 pKa = 6.83EE2 pKa = 4.55TGIIIVIVITTIIAILLFCYY22 pKa = 9.52SVCICIYY29 pKa = 8.51YY30 pKa = 8.21TVPLYY35 pKa = 10.65YY36 pKa = 10.42KK37 pKa = 10.3KK38 pKa = 10.5NKK40 pKa = 8.51KK41 pKa = 9.98KK42 pKa = 10.66KK43 pKa = 9.37IIKK46 pKa = 10.07LNEE49 pKa = 3.83IYY51 pKa = 10.69FGTNDD56 pKa = 3.13INKK59 pKa = 9.72KK60 pKa = 8.04SVEE63 pKa = 4.24YY64 pKa = 8.71ITNYY68 pKa = 7.96EE69 pKa = 3.94TDD71 pKa = 4.32DD72 pKa = 3.81IGNKK76 pKa = 10.01SVDD79 pKa = 2.83ITSYY83 pKa = 11.54DD84 pKa = 3.62EE85 pKa = 3.99NDD87 pKa = 3.85NYY89 pKa = 11.48NKK91 pKa = 10.79DD92 pKa = 3.38EE93 pKa = 4.92FIEE96 pKa = 4.18EE97 pKa = 3.9NEE99 pKa = 3.99YY100 pKa = 10.63WEE102 pKa = 5.72DD103 pKa = 3.89DD104 pKa = 4.44DD105 pKa = 6.04ISTSMSVAKK114 pKa = 10.25YY115 pKa = 9.74DD116 pKa = 3.66EE117 pKa = 5.05EE118 pKa = 5.89IIEE121 pKa = 4.72PIYY124 pKa = 11.32ANISNDD130 pKa = 3.67DD131 pKa = 3.89VINSYY136 pKa = 11.52DD137 pKa = 4.65KK138 pKa = 10.79IDD140 pKa = 3.89NNIKK144 pKa = 10.4DD145 pKa = 4.39LYY147 pKa = 11.12AIINTDD153 pKa = 3.19TNKK156 pKa = 10.56NIEE159 pKa = 4.23NDD161 pKa = 4.51DD162 pKa = 4.1EE163 pKa = 6.22IEE165 pKa = 4.26DD166 pKa = 4.28KK167 pKa = 11.05KK168 pKa = 11.28SSSNNHH174 pKa = 5.05VNVSLHH180 pKa = 6.33KK181 pKa = 9.55EE182 pKa = 3.87SEE184 pKa = 4.59PIYY187 pKa = 9.09MIPPDD192 pKa = 4.84AINN195 pKa = 3.24
MM1 pKa = 6.83EE2 pKa = 4.55TGIIIVIVITTIIAILLFCYY22 pKa = 9.52SVCICIYY29 pKa = 8.51YY30 pKa = 8.21TVPLYY35 pKa = 10.65YY36 pKa = 10.42KK37 pKa = 10.3KK38 pKa = 10.5NKK40 pKa = 8.51KK41 pKa = 9.98KK42 pKa = 10.66KK43 pKa = 9.37IIKK46 pKa = 10.07LNEE49 pKa = 3.83IYY51 pKa = 10.69FGTNDD56 pKa = 3.13INKK59 pKa = 9.72KK60 pKa = 8.04SVEE63 pKa = 4.24YY64 pKa = 8.71ITNYY68 pKa = 7.96EE69 pKa = 3.94TDD71 pKa = 4.32DD72 pKa = 3.81IGNKK76 pKa = 10.01SVDD79 pKa = 2.83ITSYY83 pKa = 11.54DD84 pKa = 3.62EE85 pKa = 3.99NDD87 pKa = 3.85NYY89 pKa = 11.48NKK91 pKa = 10.79DD92 pKa = 3.38EE93 pKa = 4.92FIEE96 pKa = 4.18EE97 pKa = 3.9NEE99 pKa = 3.99YY100 pKa = 10.63WEE102 pKa = 5.72DD103 pKa = 3.89DD104 pKa = 4.44DD105 pKa = 6.04ISTSMSVAKK114 pKa = 10.25YY115 pKa = 9.74DD116 pKa = 3.66EE117 pKa = 5.05EE118 pKa = 5.89IIEE121 pKa = 4.72PIYY124 pKa = 11.32ANISNDD130 pKa = 3.67DD131 pKa = 3.89VINSYY136 pKa = 11.52DD137 pKa = 4.65KK138 pKa = 10.79IDD140 pKa = 3.89NNIKK144 pKa = 10.4DD145 pKa = 4.39LYY147 pKa = 11.12AIINTDD153 pKa = 3.19TNKK156 pKa = 10.56NIEE159 pKa = 4.23NDD161 pKa = 4.51DD162 pKa = 4.1EE163 pKa = 6.22IEE165 pKa = 4.26DD166 pKa = 4.28KK167 pKa = 11.05KK168 pKa = 11.28SSSNNHH174 pKa = 5.05VNVSLHH180 pKa = 6.33KK181 pKa = 9.55EE182 pKa = 3.87SEE184 pKa = 4.59PIYY187 pKa = 9.09MIPPDD192 pKa = 4.84AINN195 pKa = 3.24
Molecular weight: 22.65 kDa
Isoelectric point according different methods:
Protein with the highest isoelectric point:
>tr|A0A097IVL5|A0A097IVL5_9POXV Ribonucleoside-diphosphate reductase small chain OS=Cotia virus OX=39444 GN=37 PE=3 SV=1
MM1 pKa = 7.35SSKK4 pKa = 10.6GGSSGGMWSVFIHH17 pKa = 5.83GHH19 pKa = 6.32DD20 pKa = 3.77GTVKK24 pKa = 10.32GSKK27 pKa = 9.24TYY29 pKa = 10.24TSLGGGGVKK38 pKa = 10.18SGVNGGVNGGVSSGTRR54 pKa = 11.84KK55 pKa = 9.43II56 pKa = 3.71
MM1 pKa = 7.35SSKK4 pKa = 10.6GGSSGGMWSVFIHH17 pKa = 5.83GHH19 pKa = 6.32DD20 pKa = 3.77GTVKK24 pKa = 10.32GSKK27 pKa = 9.24TYY29 pKa = 10.24TSLGGGGVKK38 pKa = 10.18SGVNGGVNGGVSSGTRR54 pKa = 11.84KK55 pKa = 9.43II56 pKa = 3.71
Molecular weight: 5.37 kDa
Isoelectric point according different methods:
Peptides (in silico digests for buttom-up proteomics)
Below you can find in silico digests of the whole proteome with Trypsin, Chymotrypsin, Trypsin+LysC, LysN, ArgC proteases suitable for different mass spec machines.| Try ESI |
 |
|---|
| ChTry ESI |
 |
|---|
| ArgC ESI |
 |
|---|
| LysN ESI |
 |
|---|
| TryLysC ESI |
 |
|---|
| Try MALDI |
 |
|---|
| ChTry MALDI |
 |
|---|
| ArgC MALDI |
 |
|---|
| LysN MALDI |
 |
|---|
| TryLysC MALDI |
 |
|---|
| Try LTQ |
 |
|---|
| ChTry LTQ |
 |
|---|
| ArgC LTQ |
 |
|---|
| LysN LTQ |
 |
|---|
| TryLysC LTQ |
 |
|---|
| Try MSlow |
 |
|---|
| ChTry MSlow |
 |
|---|
| ArgC MSlow |
 |
|---|
| LysN MSlow |
 |
|---|
| TryLysC MSlow |
 |
|---|
| Try MShigh |
 |
|---|
| ChTry MShigh |
 |
|---|
| ArgC MShigh |
 |
|---|
| LysN MShigh |
 |
|---|
| TryLysC MShigh |
 |
|---|
General Statistics
Number of major isoforms |
Number of additional isoforms |
Number of all proteins |
Number of amino acids |
Min. Seq. Length |
Max. Seq. Length |
Avg. Seq. Length |
Avg. Mol. Weight |
|---|---|---|---|---|---|---|---|
0 |
52575 |
34 |
1842 |
309.3 |
35.96 |
Amino acid frequency
Ala |
Cys |
Asp |
Glu |
Phe |
Gly |
His |
Ile |
Lys |
Leu |
|---|---|---|---|---|---|---|---|---|---|
2.195 ± 0.1 | 1.986 ± 0.09 |
6.4 ± 0.109 | 4.968 ± 0.134 |
5.08 ± 0.138 | 3.408 ± 0.114 |
1.581 ± 0.058 | 12.369 ± 0.267 |
9.132 ± 0.148 | 8.683 ± 0.157 |
Met |
Asn |
Gln |
Pro |
Arg |
Ser |
Thr |
Val |
Trp |
Tyr |
|---|---|---|---|---|---|---|---|---|---|
2.244 ± 0.068 | 9.552 ± 0.216 |
2.718 ± 0.111 | 1.653 ± 0.085 |
2.868 ± 0.116 | 7.582 ± 0.171 |
5.514 ± 0.144 | 5.253 ± 0.12 |
0.597 ± 0.042 | 6.216 ± 0.149 |
Most of the basic statistics you can see at this page can be downloaded from this CSV file
Proteome-pI is available under Creative Commons Attribution-NoDerivs license, for more details see here
| Reference: Kozlowski LP. Proteome-pI 2.0: Proteome Isoelectric Point Database Update. Nucleic Acids Res. 2021, doi: 10.1093/nar/gkab944 | Contact: Lukasz P. Kozlowski |
