Enterococcus phoeniculicola ATCC BAA-412
Taxonomy: cellular organisms; Bacteria; Terrabacteria group; Firmicutes; Bacilli; Lactobacillales; Enterococcaceae; Enterococcus; Enterococcus phoeniculicola
Average proteome isoelectric point is 6.2
Get precalculated fractions of proteins

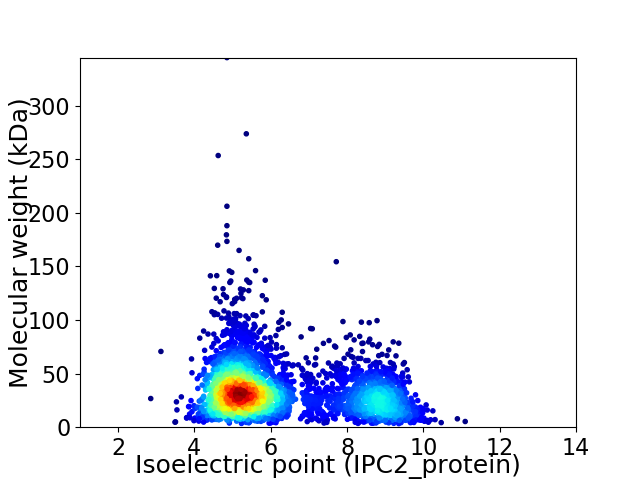
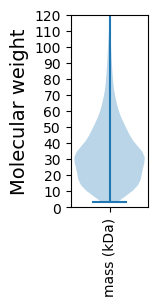
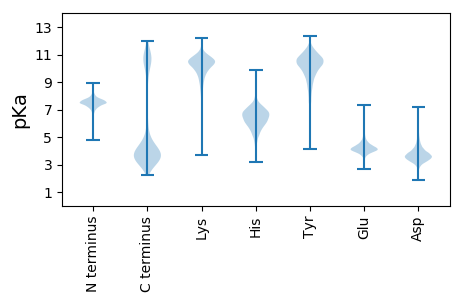
Virtual 2D-PAGE plot for 3510 proteins (isoelectric point calculated using IPC2_protein)
Get csv file with sequences according to given criteria:
* You can choose from 21 different methods for calculating isoelectric point
Summary statistics related to proteome-wise predictions


Protein with the lowest isoelectric point:
>tr|R3TGN0|R3TGN0_9ENTE Fructokinase OS=Enterococcus phoeniculicola ATCC BAA-412 OX=1158610 GN=UC3_03552 PE=4 SV=1
MM1 pKa = 7.46KK2 pKa = 10.0KK3 pKa = 9.58ILVISVVSGTMLFGMLLASNEE24 pKa = 3.9SHH26 pKa = 6.38AAEE29 pKa = 4.29WTANTPDD36 pKa = 5.03RR37 pKa = 11.84IQISDD42 pKa = 3.68GQTSYY47 pKa = 11.4TMVFGDD53 pKa = 4.1TLWAISQKK61 pKa = 9.89TNLNLQTLADD71 pKa = 4.18LNKK74 pKa = 9.75VNLLAGDD81 pKa = 3.62QYY83 pKa = 11.2GLQVGRR89 pKa = 11.84VISFDD94 pKa = 3.27GATVTVTEE102 pKa = 4.12SDD104 pKa = 3.57GTVVNQATVTDD115 pKa = 4.07EE116 pKa = 4.15NKK118 pKa = 10.05VNSEE122 pKa = 4.07QAVGQAVDD130 pKa = 3.84PTATEE135 pKa = 3.81QNYY138 pKa = 10.44GGSGLAASGYY148 pKa = 9.93VDD150 pKa = 4.3NGDD153 pKa = 3.49GTSTNTSTGEE163 pKa = 4.18VIDD166 pKa = 4.24NATGAPVTPTPTPTEE181 pKa = 4.1PSTPAEE187 pKa = 4.04PTEE190 pKa = 4.1PTEE193 pKa = 4.16PTEE196 pKa = 4.24PTDD199 pKa = 3.64PSEE202 pKa = 4.63PEE204 pKa = 4.24VPEE207 pKa = 4.27GPYY210 pKa = 10.74AGDD213 pKa = 3.15ILSGVEE219 pKa = 3.66NGLVGTYY226 pKa = 10.05TDD228 pKa = 5.7DD229 pKa = 3.68EE230 pKa = 5.25ALMDD234 pKa = 5.3AMDD237 pKa = 4.9AYY239 pKa = 10.08KK240 pKa = 10.53LANDD244 pKa = 3.88LHH246 pKa = 7.67GSEE249 pKa = 4.25WDD251 pKa = 3.67YY252 pKa = 11.74LILSNGYY259 pKa = 8.0GWYY262 pKa = 10.3AVWVNQQ268 pKa = 4.52
MM1 pKa = 7.46KK2 pKa = 10.0KK3 pKa = 9.58ILVISVVSGTMLFGMLLASNEE24 pKa = 3.9SHH26 pKa = 6.38AAEE29 pKa = 4.29WTANTPDD36 pKa = 5.03RR37 pKa = 11.84IQISDD42 pKa = 3.68GQTSYY47 pKa = 11.4TMVFGDD53 pKa = 4.1TLWAISQKK61 pKa = 9.89TNLNLQTLADD71 pKa = 4.18LNKK74 pKa = 9.75VNLLAGDD81 pKa = 3.62QYY83 pKa = 11.2GLQVGRR89 pKa = 11.84VISFDD94 pKa = 3.27GATVTVTEE102 pKa = 4.12SDD104 pKa = 3.57GTVVNQATVTDD115 pKa = 4.07EE116 pKa = 4.15NKK118 pKa = 10.05VNSEE122 pKa = 4.07QAVGQAVDD130 pKa = 3.84PTATEE135 pKa = 3.81QNYY138 pKa = 10.44GGSGLAASGYY148 pKa = 9.93VDD150 pKa = 4.3NGDD153 pKa = 3.49GTSTNTSTGEE163 pKa = 4.18VIDD166 pKa = 4.24NATGAPVTPTPTPTEE181 pKa = 4.1PSTPAEE187 pKa = 4.04PTEE190 pKa = 4.1PTEE193 pKa = 4.16PTEE196 pKa = 4.24PTDD199 pKa = 3.64PSEE202 pKa = 4.63PEE204 pKa = 4.24VPEE207 pKa = 4.27GPYY210 pKa = 10.74AGDD213 pKa = 3.15ILSGVEE219 pKa = 3.66NGLVGTYY226 pKa = 10.05TDD228 pKa = 5.7DD229 pKa = 3.68EE230 pKa = 5.25ALMDD234 pKa = 5.3AMDD237 pKa = 4.9AYY239 pKa = 10.08KK240 pKa = 10.53LANDD244 pKa = 3.88LHH246 pKa = 7.67GSEE249 pKa = 4.25WDD251 pKa = 3.67YY252 pKa = 11.74LILSNGYY259 pKa = 8.0GWYY262 pKa = 10.3AVWVNQQ268 pKa = 4.52
Molecular weight: 28.26 kDa
Isoelectric point according different methods:
Protein with the highest isoelectric point:
>tr|R3U5S0|R3U5S0_9ENTE Protein RecA OS=Enterococcus phoeniculicola ATCC BAA-412 OX=1158610 GN=recA PE=3 SV=1
MM1 pKa = 7.35KK2 pKa = 9.42RR3 pKa = 11.84TYY5 pKa = 10.34QPNKK9 pKa = 9.16RR10 pKa = 11.84KK11 pKa = 9.12RR12 pKa = 11.84QKK14 pKa = 9.38VHH16 pKa = 5.8GFRR19 pKa = 11.84KK20 pKa = 10.04RR21 pKa = 11.84MSTKK25 pKa = 9.46NGRR28 pKa = 11.84RR29 pKa = 11.84VLASRR34 pKa = 11.84RR35 pKa = 11.84LKK37 pKa = 10.13GRR39 pKa = 11.84KK40 pKa = 8.79VLSAA44 pKa = 4.05
MM1 pKa = 7.35KK2 pKa = 9.42RR3 pKa = 11.84TYY5 pKa = 10.34QPNKK9 pKa = 9.16RR10 pKa = 11.84KK11 pKa = 9.12RR12 pKa = 11.84QKK14 pKa = 9.38VHH16 pKa = 5.8GFRR19 pKa = 11.84KK20 pKa = 10.04RR21 pKa = 11.84MSTKK25 pKa = 9.46NGRR28 pKa = 11.84RR29 pKa = 11.84VLASRR34 pKa = 11.84RR35 pKa = 11.84LKK37 pKa = 10.13GRR39 pKa = 11.84KK40 pKa = 8.79VLSAA44 pKa = 4.05
Molecular weight: 5.31 kDa
Isoelectric point according different methods:
Peptides (in silico digests for buttom-up proteomics)
Below you can find in silico digests of the whole proteome with Trypsin, Chymotrypsin, Trypsin+LysC, LysN, ArgC proteases suitable for different mass spec machines.| Try ESI |
 |
|---|
| ChTry ESI |
 |
|---|
| ArgC ESI |
 |
|---|
| LysN ESI |
 |
|---|
| TryLysC ESI |
 |
|---|
| Try MALDI |
 |
|---|
| ChTry MALDI |
 |
|---|
| ArgC MALDI |
 |
|---|
| LysN MALDI |
 |
|---|
| TryLysC MALDI |
 |
|---|
| Try LTQ |
 |
|---|
| ChTry LTQ |
 |
|---|
| ArgC LTQ |
 |
|---|
| LysN LTQ |
 |
|---|
| TryLysC LTQ |
 |
|---|
| Try MSlow |
 |
|---|
| ChTry MSlow |
 |
|---|
| ArgC MSlow |
 |
|---|
| LysN MSlow |
 |
|---|
| TryLysC MSlow |
 |
|---|
| Try MShigh |
 |
|---|
| ChTry MShigh |
 |
|---|
| ArgC MShigh |
 |
|---|
| LysN MShigh |
 |
|---|
| TryLysC MShigh |
 |
|---|
General Statistics
Number of major isoforms |
Number of additional isoforms |
Number of all proteins |
Number of amino acids |
Min. Seq. Length |
Max. Seq. Length |
Avg. Seq. Length |
Avg. Mol. Weight |
|---|---|---|---|---|---|---|---|
0 |
1105453 |
27 |
3052 |
314.9 |
35.45 |
Amino acid frequency
Ala |
Cys |
Asp |
Glu |
Phe |
Gly |
His |
Ile |
Lys |
Leu |
|---|---|---|---|---|---|---|---|---|---|
6.657 ± 0.053 | 0.642 ± 0.011 |
5.017 ± 0.039 | 7.553 ± 0.051 |
4.81 ± 0.038 | 6.521 ± 0.048 |
1.765 ± 0.02 | 7.735 ± 0.04 |
7.073 ± 0.034 | 9.958 ± 0.051 |
Met |
Asn |
Gln |
Pro |
Arg |
Ser |
Thr |
Val |
Trp |
Tyr |
|---|---|---|---|---|---|---|---|---|---|
2.673 ± 0.022 | 4.631 ± 0.032 |
3.366 ± 0.021 | 4.086 ± 0.034 |
3.532 ± 0.031 | 6.364 ± 0.033 |
6.006 ± 0.044 | 6.765 ± 0.034 |
1.012 ± 0.016 | 3.835 ± 0.028 |
Most of the basic statistics you can see at this page can be downloaded from this CSV file
Proteome-pI is available under Creative Commons Attribution-NoDerivs license, for more details see here
| Reference: Kozlowski LP. Proteome-pI 2.0: Proteome Isoelectric Point Database Update. Nucleic Acids Res. 2021, doi: 10.1093/nar/gkab944 | Contact: Lukasz P. Kozlowski |
