Hyaloscypha variabilis F
Taxonomy: cellular organisms; Eukaryota; Opisthokonta; Fungi; Dikarya; Ascomycota; saccharomyceta; Pezizomycotina; leotiomyceta; sordariomyceta; Leotiomycetes; Helotiales; Hyaloscyphaceae; Hyaloscypha; Hyaloscypha hepaticicola/Rhizoscyphus ericae species complex; Hyaloscypha variabilis
Average proteome isoelectric point is 6.45
Get precalculated fractions of proteins

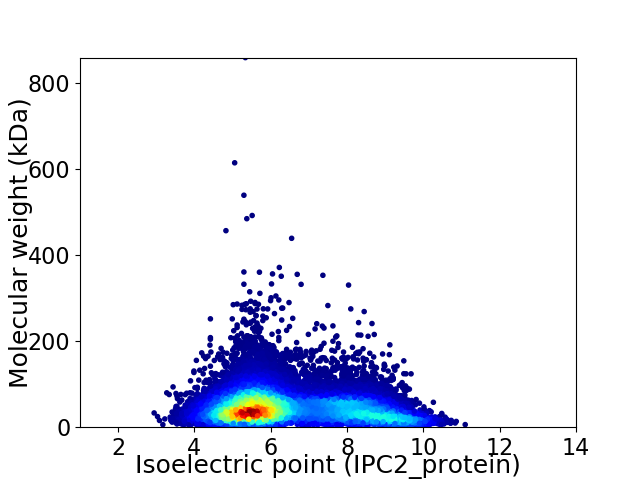
Virtual 2D-PAGE plot for 20347 proteins (isoelectric point calculated using IPC2_protein)
Get csv file with sequences according to given criteria:
* You can choose from 21 different methods for calculating isoelectric point
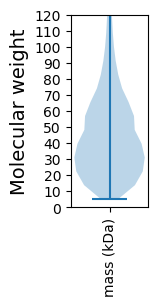
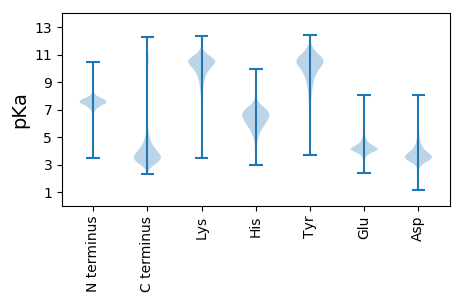
Summary statistics related to proteome-wise predictions


Protein with the lowest isoelectric point:
>tr|A0A2J6RIR4|A0A2J6RIR4_9HELO Adenylyl cyclase (Fragment) OS=Hyaloscypha variabilis F OX=1149755 GN=L207DRAFT_387266 PE=4 SV=1
MM1 pKa = 6.84VQISLLLGLAAISQVLAAPAPAPTAAPDD29 pKa = 3.58LEE31 pKa = 4.63KK32 pKa = 10.7RR33 pKa = 11.84ATTCTFSGSGGASSASKK50 pKa = 10.8SKK52 pKa = 9.59TSCSTIILSALAVPSGVTLDD72 pKa = 3.77LTDD75 pKa = 4.47LNEE78 pKa = 4.1GTTVIFEE85 pKa = 4.37GEE87 pKa = 4.14TTFGYY92 pKa = 10.01EE93 pKa = 3.88EE94 pKa = 4.03WSGPLFAVSGTDD106 pKa = 2.99ITVTQSSGAYY116 pKa = 10.26LNGNGADD123 pKa = 3.09WWDD126 pKa = 3.86GEE128 pKa = 4.29GSNGGKK134 pKa = 8.26TKK136 pKa = 10.58PKK138 pKa = 10.14FFQAHH143 pKa = 5.32NLISSTISDD152 pKa = 3.93IYY154 pKa = 10.64ILNPPVQVFSIDD166 pKa = 3.47DD167 pKa = 3.9CTDD170 pKa = 3.33LTVSGITIDD179 pKa = 3.74GTAGDD184 pKa = 4.1SLGANTDD191 pKa = 3.13GFDD194 pKa = 3.53IGDD197 pKa = 3.99STSVTISGANVYY209 pKa = 10.16NQDD212 pKa = 3.1DD213 pKa = 4.24CVAVNSGTDD222 pKa = 3.0ITFTGGVCSGGHH234 pKa = 5.7GLSIGSVGGRR244 pKa = 11.84SDD246 pKa = 3.59NTVDD250 pKa = 3.36TVNFLSSEE258 pKa = 4.31VKK260 pKa = 10.49DD261 pKa = 3.65SQNGVRR267 pKa = 11.84IKK269 pKa = 9.9TISGDD274 pKa = 3.49TGSVTGVTYY283 pKa = 11.04KK284 pKa = 10.86DD285 pKa = 3.11ITLSGITDD293 pKa = 3.35YY294 pKa = 11.65GIVVRR299 pKa = 11.84QDD301 pKa = 3.21YY302 pKa = 10.94DD303 pKa = 3.64GTSGDD308 pKa = 3.85PTNGITIKK316 pKa = 10.93DD317 pKa = 3.69FVLDD321 pKa = 3.85NVQGTVEE328 pKa = 4.11STATDD333 pKa = 3.61VYY335 pKa = 10.13ILCGSGSCTDD345 pKa = 3.52WTWTDD350 pKa = 3.32VSVTGGKK357 pKa = 10.07VSTGCLNLPSGISCDD372 pKa = 3.51VV373 pKa = 3.06
MM1 pKa = 6.84VQISLLLGLAAISQVLAAPAPAPTAAPDD29 pKa = 3.58LEE31 pKa = 4.63KK32 pKa = 10.7RR33 pKa = 11.84ATTCTFSGSGGASSASKK50 pKa = 10.8SKK52 pKa = 9.59TSCSTIILSALAVPSGVTLDD72 pKa = 3.77LTDD75 pKa = 4.47LNEE78 pKa = 4.1GTTVIFEE85 pKa = 4.37GEE87 pKa = 4.14TTFGYY92 pKa = 10.01EE93 pKa = 3.88EE94 pKa = 4.03WSGPLFAVSGTDD106 pKa = 2.99ITVTQSSGAYY116 pKa = 10.26LNGNGADD123 pKa = 3.09WWDD126 pKa = 3.86GEE128 pKa = 4.29GSNGGKK134 pKa = 8.26TKK136 pKa = 10.58PKK138 pKa = 10.14FFQAHH143 pKa = 5.32NLISSTISDD152 pKa = 3.93IYY154 pKa = 10.64ILNPPVQVFSIDD166 pKa = 3.47DD167 pKa = 3.9CTDD170 pKa = 3.33LTVSGITIDD179 pKa = 3.74GTAGDD184 pKa = 4.1SLGANTDD191 pKa = 3.13GFDD194 pKa = 3.53IGDD197 pKa = 3.99STSVTISGANVYY209 pKa = 10.16NQDD212 pKa = 3.1DD213 pKa = 4.24CVAVNSGTDD222 pKa = 3.0ITFTGGVCSGGHH234 pKa = 5.7GLSIGSVGGRR244 pKa = 11.84SDD246 pKa = 3.59NTVDD250 pKa = 3.36TVNFLSSEE258 pKa = 4.31VKK260 pKa = 10.49DD261 pKa = 3.65SQNGVRR267 pKa = 11.84IKK269 pKa = 9.9TISGDD274 pKa = 3.49TGSVTGVTYY283 pKa = 11.04KK284 pKa = 10.86DD285 pKa = 3.11ITLSGITDD293 pKa = 3.35YY294 pKa = 11.65GIVVRR299 pKa = 11.84QDD301 pKa = 3.21YY302 pKa = 10.94DD303 pKa = 3.64GTSGDD308 pKa = 3.85PTNGITIKK316 pKa = 10.93DD317 pKa = 3.69FVLDD321 pKa = 3.85NVQGTVEE328 pKa = 4.11STATDD333 pKa = 3.61VYY335 pKa = 10.13ILCGSGSCTDD345 pKa = 3.52WTWTDD350 pKa = 3.32VSVTGGKK357 pKa = 10.07VSTGCLNLPSGISCDD372 pKa = 3.51VV373 pKa = 3.06
Molecular weight: 38.01 kDa
Isoelectric point according different methods:
Protein with the highest isoelectric point:
>tr|A0A2J6RZD0|A0A2J6RZD0_9HELO Uncharacterized protein OS=Hyaloscypha variabilis F OX=1149755 GN=L207DRAFT_422060 PE=4 SV=1
SS1 pKa = 6.85HH2 pKa = 7.5KK3 pKa = 10.71SFRR6 pKa = 11.84TKK8 pKa = 10.44QKK10 pKa = 10.05LARR13 pKa = 11.84AQKK16 pKa = 8.97QNRR19 pKa = 11.84PIPQWIRR26 pKa = 11.84LRR28 pKa = 11.84TGNTIRR34 pKa = 11.84YY35 pKa = 5.79NAKK38 pKa = 8.89RR39 pKa = 11.84RR40 pKa = 11.84HH41 pKa = 4.15WRR43 pKa = 11.84KK44 pKa = 7.38TRR46 pKa = 11.84IGII49 pKa = 4.0
SS1 pKa = 6.85HH2 pKa = 7.5KK3 pKa = 10.71SFRR6 pKa = 11.84TKK8 pKa = 10.44QKK10 pKa = 10.05LARR13 pKa = 11.84AQKK16 pKa = 8.97QNRR19 pKa = 11.84PIPQWIRR26 pKa = 11.84LRR28 pKa = 11.84TGNTIRR34 pKa = 11.84YY35 pKa = 5.79NAKK38 pKa = 8.89RR39 pKa = 11.84RR40 pKa = 11.84HH41 pKa = 4.15WRR43 pKa = 11.84KK44 pKa = 7.38TRR46 pKa = 11.84IGII49 pKa = 4.0
Molecular weight: 6.05 kDa
Isoelectric point according different methods:
Peptides (in silico digests for buttom-up proteomics)
Below you can find in silico digests of the whole proteome with Trypsin, Chymotrypsin, Trypsin+LysC, LysN, ArgC proteases suitable for different mass spec machines.| Try ESI |
 |
|---|
| ChTry ESI |
 |
|---|
| ArgC ESI |
 |
|---|
| LysN ESI |
 |
|---|
| TryLysC ESI |
 |
|---|
| Try MALDI |
 |
|---|
| ChTry MALDI |
 |
|---|
| ArgC MALDI |
 |
|---|
| LysN MALDI |
 |
|---|
| TryLysC MALDI |
 |
|---|
| Try LTQ |
 |
|---|
| ChTry LTQ |
 |
|---|
| ArgC LTQ |
 |
|---|
| LysN LTQ |
 |
|---|
| TryLysC LTQ |
 |
|---|
| Try MSlow |
 |
|---|
| ChTry MSlow |
 |
|---|
| ArgC MSlow |
 |
|---|
| LysN MSlow |
 |
|---|
| TryLysC MSlow |
 |
|---|
| Try MShigh |
 |
|---|
| ChTry MShigh |
 |
|---|
| ArgC MShigh |
 |
|---|
| LysN MShigh |
 |
|---|
| TryLysC MShigh |
 |
|---|
General Statistics
Number of major isoforms |
Number of additional isoforms |
Number of all proteins |
Number of amino acids |
Min. Seq. Length |
Max. Seq. Length |
Avg. Seq. Length |
Avg. Mol. Weight |
|---|---|---|---|---|---|---|---|
8940297 |
49 |
7742 |
439.4 |
48.77 |
Amino acid frequency
Ala |
Cys |
Asp |
Glu |
Phe |
Gly |
His |
Ile |
Lys |
Leu |
|---|---|---|---|---|---|---|---|---|---|
8.089 ± 0.014 | 1.403 ± 0.008 |
5.344 ± 0.011 | 6.217 ± 0.018 |
4.005 ± 0.011 | 6.871 ± 0.015 |
2.308 ± 0.008 | 5.397 ± 0.013 |
4.949 ± 0.013 | 9.2 ± 0.018 |
Met |
Asn |
Gln |
Pro |
Arg |
Ser |
Thr |
Val |
Trp |
Tyr |
|---|---|---|---|---|---|---|---|---|---|
2.141 ± 0.006 | 3.816 ± 0.009 |
5.734 ± 0.018 | 3.865 ± 0.011 |
5.73 ± 0.016 | 8.308 ± 0.021 |
6.061 ± 0.013 | 6.031 ± 0.012 |
1.634 ± 0.007 | 2.896 ± 0.009 |
Most of the basic statistics you can see at this page can be downloaded from this CSV file
Proteome-pI is available under Creative Commons Attribution-NoDerivs license, for more details see here
| Reference: Kozlowski LP. Proteome-pI 2.0: Proteome Isoelectric Point Database Update. Nucleic Acids Res. 2021, doi: 10.1093/nar/gkab944 | Contact: Lukasz P. Kozlowski |
