Candidatus Atribacteria bacterium MT.SAG.1
Taxonomy: cellular organisms; Bacteria; Atribacterota; unclassified Atribacterota
Average proteome isoelectric point is 7.34
Get precalculated fractions of proteins

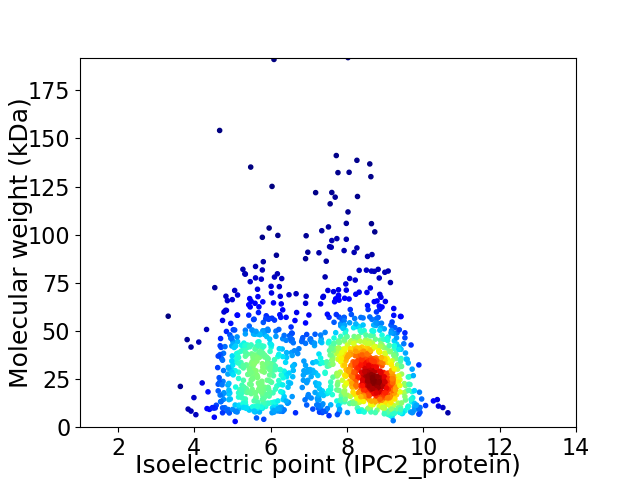
Virtual 2D-PAGE plot for 1304 proteins (isoelectric point calculated using IPC2_protein)
Get csv file with sequences according to given criteria:
* You can choose from 21 different methods for calculating isoelectric point
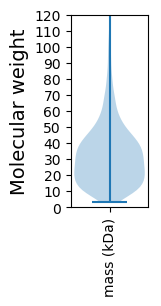
Summary statistics related to proteome-wise predictions


Protein with the lowest isoelectric point:
>tr|A0A4Y8I4G9|A0A4Y8I4G9_9BACT RNA-splicing ligase RtcB OS=Candidatus Atribacteria bacterium MT.SAG.1 OX=2552984 GN=rtcB PE=3 SV=1
MM1 pKa = 7.48NSMKK5 pKa = 10.26VKK7 pKa = 9.52RR8 pKa = 11.84TIIFLLVIGIMVVVAGCARR27 pKa = 11.84WPDD30 pKa = 3.76GPGPGPGEE38 pKa = 3.89PEE40 pKa = 4.0YY41 pKa = 10.79QLEE44 pKa = 4.28ITVEE48 pKa = 4.03VAGVINSSDD57 pKa = 3.51GIYY60 pKa = 10.51YY61 pKa = 9.93IVLDD65 pKa = 4.44ADD67 pKa = 4.0EE68 pKa = 4.76EE69 pKa = 4.97SIDD72 pKa = 5.02GPEE75 pKa = 4.81DD76 pKa = 4.01DD77 pKa = 5.18AKK79 pKa = 11.18DD80 pKa = 3.56WEE82 pKa = 4.51DD83 pKa = 3.18DD84 pKa = 3.8FYY86 pKa = 11.69YY87 pKa = 11.2VKK89 pKa = 10.79LDD91 pKa = 3.27GMDD94 pKa = 3.29FHH96 pKa = 7.23FARR99 pKa = 11.84VEE101 pKa = 3.95EE102 pKa = 5.39GSASMSLTDD111 pKa = 4.21SSYY114 pKa = 11.61SEE116 pKa = 5.7DD117 pKa = 3.48KK118 pKa = 11.16LQVTIALSDD127 pKa = 3.96LEE129 pKa = 5.05DD130 pKa = 4.61PNSIDD135 pKa = 3.32INVITTDD142 pKa = 3.7SDD144 pKa = 3.74NNTYY148 pKa = 11.33DD149 pKa = 3.62HH150 pKa = 7.44LDD152 pKa = 3.55GYY154 pKa = 8.65FTINTVLGEE163 pKa = 4.23TEE165 pKa = 4.01EE166 pKa = 4.79GVVSEE171 pKa = 4.78GGSEE175 pKa = 3.82EE176 pKa = 4.19GGADD180 pKa = 3.38FDD182 pKa = 4.77IIKK185 pKa = 8.57VTAEE189 pKa = 3.44ITTLYY194 pKa = 10.88
MM1 pKa = 7.48NSMKK5 pKa = 10.26VKK7 pKa = 9.52RR8 pKa = 11.84TIIFLLVIGIMVVVAGCARR27 pKa = 11.84WPDD30 pKa = 3.76GPGPGPGEE38 pKa = 3.89PEE40 pKa = 4.0YY41 pKa = 10.79QLEE44 pKa = 4.28ITVEE48 pKa = 4.03VAGVINSSDD57 pKa = 3.51GIYY60 pKa = 10.51YY61 pKa = 9.93IVLDD65 pKa = 4.44ADD67 pKa = 4.0EE68 pKa = 4.76EE69 pKa = 4.97SIDD72 pKa = 5.02GPEE75 pKa = 4.81DD76 pKa = 4.01DD77 pKa = 5.18AKK79 pKa = 11.18DD80 pKa = 3.56WEE82 pKa = 4.51DD83 pKa = 3.18DD84 pKa = 3.8FYY86 pKa = 11.69YY87 pKa = 11.2VKK89 pKa = 10.79LDD91 pKa = 3.27GMDD94 pKa = 3.29FHH96 pKa = 7.23FARR99 pKa = 11.84VEE101 pKa = 3.95EE102 pKa = 5.39GSASMSLTDD111 pKa = 4.21SSYY114 pKa = 11.61SEE116 pKa = 5.7DD117 pKa = 3.48KK118 pKa = 11.16LQVTIALSDD127 pKa = 3.96LEE129 pKa = 5.05DD130 pKa = 4.61PNSIDD135 pKa = 3.32INVITTDD142 pKa = 3.7SDD144 pKa = 3.74NNTYY148 pKa = 11.33DD149 pKa = 3.62HH150 pKa = 7.44LDD152 pKa = 3.55GYY154 pKa = 8.65FTINTVLGEE163 pKa = 4.23TEE165 pKa = 4.01EE166 pKa = 4.79GVVSEE171 pKa = 4.78GGSEE175 pKa = 3.82EE176 pKa = 4.19GGADD180 pKa = 3.38FDD182 pKa = 4.77IIKK185 pKa = 8.57VTAEE189 pKa = 3.44ITTLYY194 pKa = 10.88
Molecular weight: 21.17 kDa
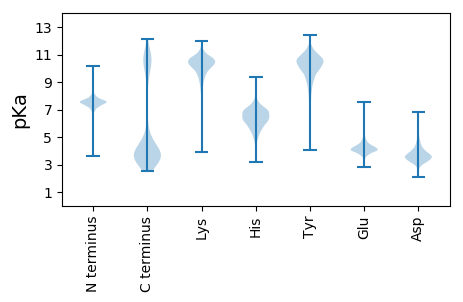
Isoelectric point according different methods:
Protein with the highest isoelectric point:
>tr|A0A4Y8I0J7|A0A4Y8I0J7_9BACT Uncharacterized protein OS=Candidatus Atribacteria bacterium MT.SAG.1 OX=2552984 GN=E3V08_03490 PE=4 SV=1
MM1 pKa = 7.32ARR3 pKa = 11.84YY4 pKa = 9.69GFFRR8 pKa = 11.84RR9 pKa = 11.84PQRR12 pKa = 11.84KK13 pKa = 8.12VCLFCKK19 pKa = 9.99EE20 pKa = 4.6KK21 pKa = 10.6IVADD25 pKa = 3.97YY26 pKa = 11.33KK27 pKa = 11.39DD28 pKa = 3.34VDD30 pKa = 4.32LLRR33 pKa = 11.84KK34 pKa = 9.88FITEE38 pKa = 3.57QGKK41 pKa = 9.04ILSRR45 pKa = 11.84RR46 pKa = 11.84VTGNCARR53 pKa = 11.84HH54 pKa = 5.04QRR56 pKa = 11.84TLAMSIKK63 pKa = 9.44RR64 pKa = 11.84ARR66 pKa = 11.84EE67 pKa = 3.5IGLLHH72 pKa = 5.97YY73 pKa = 9.61VAKK76 pKa = 10.67
MM1 pKa = 7.32ARR3 pKa = 11.84YY4 pKa = 9.69GFFRR8 pKa = 11.84RR9 pKa = 11.84PQRR12 pKa = 11.84KK13 pKa = 8.12VCLFCKK19 pKa = 9.99EE20 pKa = 4.6KK21 pKa = 10.6IVADD25 pKa = 3.97YY26 pKa = 11.33KK27 pKa = 11.39DD28 pKa = 3.34VDD30 pKa = 4.32LLRR33 pKa = 11.84KK34 pKa = 9.88FITEE38 pKa = 3.57QGKK41 pKa = 9.04ILSRR45 pKa = 11.84RR46 pKa = 11.84VTGNCARR53 pKa = 11.84HH54 pKa = 5.04QRR56 pKa = 11.84TLAMSIKK63 pKa = 9.44RR64 pKa = 11.84ARR66 pKa = 11.84EE67 pKa = 3.5IGLLHH72 pKa = 5.97YY73 pKa = 9.61VAKK76 pKa = 10.67
Molecular weight: 9.0 kDa
Isoelectric point according different methods:
Peptides (in silico digests for buttom-up proteomics)
Below you can find in silico digests of the whole proteome with Trypsin, Chymotrypsin, Trypsin+LysC, LysN, ArgC proteases suitable for different mass spec machines.| Try ESI |
 |
|---|
| ChTry ESI |
 |
|---|
| ArgC ESI |
 |
|---|
| LysN ESI |
 |
|---|
| TryLysC ESI |
 |
|---|
| Try MALDI |
 |
|---|
| ChTry MALDI |
 |
|---|
| ArgC MALDI |
 |
|---|
| LysN MALDI |
 |
|---|
| TryLysC MALDI |
 |
|---|
| Try LTQ |
 |
|---|
| ChTry LTQ |
 |
|---|
| ArgC LTQ |
 |
|---|
| LysN LTQ |
 |
|---|
| TryLysC LTQ |
 |
|---|
| Try MSlow |
 |
|---|
| ChTry MSlow |
 |
|---|
| ArgC MSlow |
 |
|---|
| LysN MSlow |
 |
|---|
| TryLysC MSlow |
 |
|---|
| Try MShigh |
 |
|---|
| ChTry MShigh |
 |
|---|
| ArgC MShigh |
 |
|---|
| LysN MShigh |
 |
|---|
| TryLysC MShigh |
 |
|---|
General Statistics
Number of major isoforms |
Number of additional isoforms |
Number of all proteins |
Number of amino acids |
Min. Seq. Length |
Max. Seq. Length |
Avg. Seq. Length |
Avg. Mol. Weight |
|---|---|---|---|---|---|---|---|
0 |
391623 |
25 |
1694 |
300.3 |
33.91 |
Amino acid frequency
Ala |
Cys |
Asp |
Glu |
Phe |
Gly |
His |
Ile |
Lys |
Leu |
|---|---|---|---|---|---|---|---|---|---|
5.93 ± 0.078 | 1.08 ± 0.026 |
4.828 ± 0.044 | 7.614 ± 0.07 |
4.402 ± 0.055 | 6.789 ± 0.065 |
1.479 ± 0.025 | 10.182 ± 0.072 |
9.455 ± 0.074 | 9.788 ± 0.078 |
Met |
Asn |
Gln |
Pro |
Arg |
Ser |
Thr |
Val |
Trp |
Tyr |
|---|---|---|---|---|---|---|---|---|---|
2.212 ± 0.027 | 4.862 ± 0.056 |
3.517 ± 0.036 | 2.721 ± 0.033 |
4.229 ± 0.046 | 5.784 ± 0.046 |
4.541 ± 0.041 | 6.252 ± 0.052 |
0.804 ± 0.022 | 3.533 ± 0.046 |
Most of the basic statistics you can see at this page can be downloaded from this CSV file
Proteome-pI is available under Creative Commons Attribution-NoDerivs license, for more details see here
| Reference: Kozlowski LP. Proteome-pI 2.0: Proteome Isoelectric Point Database Update. Nucleic Acids Res. 2021, doi: 10.1093/nar/gkab944 | Contact: Lukasz P. Kozlowski |
