Enterobacteria phage N4 (Bacteriophage N4)
Taxonomy: Viruses; Duplodnaviria; Heunggongvirae; Uroviricota; Caudoviricetes; Caudovirales; Schitoviridae; Enquatrovirinae; Enquatrovirus
Average proteome isoelectric point is 6.29
Get precalculated fractions of proteins

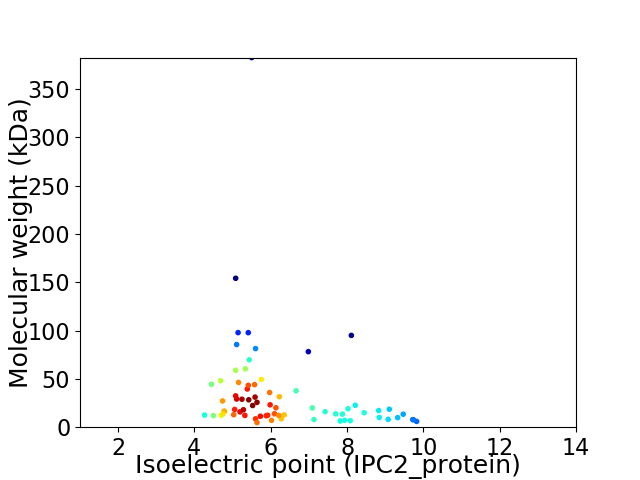
Virtual 2D-PAGE plot for 72 proteins (isoelectric point calculated using IPC2_protein)
Get csv file with sequences according to given criteria:
* You can choose from 21 different methods for calculating isoelectric point
Summary statistics related to proteome-wise predictions


Protein with the lowest isoelectric point:
>tr|A0MZA9|A0MZA9_BPN4 Gp19 OS=Enterobacteria phage N4 OX=10752 PE=4 SV=1
MM1 pKa = 7.5ANKK4 pKa = 9.6NRR6 pKa = 11.84LRR8 pKa = 11.84VWHH11 pKa = 6.79IPQVPGKK18 pKa = 9.58AFYY21 pKa = 11.29VEE23 pKa = 3.89VDD25 pKa = 3.55SVEE28 pKa = 3.97EE29 pKa = 4.04GVRR32 pKa = 11.84IIDD35 pKa = 3.24ILANYY40 pKa = 10.59DD41 pKa = 3.41LFQYY45 pKa = 10.19EE46 pKa = 4.25NNIKK50 pKa = 10.58GDD52 pKa = 3.66YY53 pKa = 10.15CNVSGLQMYY62 pKa = 9.93DD63 pKa = 3.06EE64 pKa = 5.96HH65 pKa = 6.79ITDD68 pKa = 4.98DD69 pKa = 3.7EE70 pKa = 4.33MEE72 pKa = 4.31EE73 pKa = 3.95MGLTDD78 pKa = 5.19RR79 pKa = 11.84WVDD82 pKa = 2.88WYY84 pKa = 11.67YY85 pKa = 11.35EE86 pKa = 4.07DD87 pKa = 5.36DD88 pKa = 4.63QNFFDD93 pKa = 5.39NPKK96 pKa = 10.5EE97 pKa = 3.87YY98 pKa = 11.17LNNLKK103 pKa = 10.38KK104 pKa = 10.79
MM1 pKa = 7.5ANKK4 pKa = 9.6NRR6 pKa = 11.84LRR8 pKa = 11.84VWHH11 pKa = 6.79IPQVPGKK18 pKa = 9.58AFYY21 pKa = 11.29VEE23 pKa = 3.89VDD25 pKa = 3.55SVEE28 pKa = 3.97EE29 pKa = 4.04GVRR32 pKa = 11.84IIDD35 pKa = 3.24ILANYY40 pKa = 10.59DD41 pKa = 3.41LFQYY45 pKa = 10.19EE46 pKa = 4.25NNIKK50 pKa = 10.58GDD52 pKa = 3.66YY53 pKa = 10.15CNVSGLQMYY62 pKa = 9.93DD63 pKa = 3.06EE64 pKa = 5.96HH65 pKa = 6.79ITDD68 pKa = 4.98DD69 pKa = 3.7EE70 pKa = 4.33MEE72 pKa = 4.31EE73 pKa = 3.95MGLTDD78 pKa = 5.19RR79 pKa = 11.84WVDD82 pKa = 2.88WYY84 pKa = 11.67YY85 pKa = 11.35EE86 pKa = 4.07DD87 pKa = 5.36DD88 pKa = 4.63QNFFDD93 pKa = 5.39NPKK96 pKa = 10.5EE97 pKa = 3.87YY98 pKa = 11.17LNNLKK103 pKa = 10.38KK104 pKa = 10.79
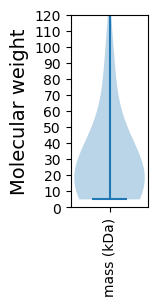
Molecular weight: 12.52 kDa
Isoelectric point according different methods:
Protein with the highest isoelectric point:
>tr|A0MZB3|A0MZB3_BPN4 Gp23 OS=Enterobacteria phage N4 OX=10752 PE=4 SV=1
MM1 pKa = 7.18AQEE4 pKa = 3.98KK5 pKa = 10.18NRR7 pKa = 11.84RR8 pKa = 11.84QTLIEE13 pKa = 4.82RR14 pKa = 11.84IQARR18 pKa = 11.84IKK20 pKa = 10.87LQDD23 pKa = 3.26LGYY26 pKa = 8.55TVNGQPSLCHH36 pKa = 6.0IWTGSHH42 pKa = 6.17SGNGRR47 pKa = 11.84GGQYY51 pKa = 11.06GRR53 pKa = 11.84ISVNGVTSATHH64 pKa = 6.33IIAYY68 pKa = 5.27THH70 pKa = 4.68YY71 pKa = 10.48HH72 pKa = 6.22GYY74 pKa = 9.71IPNKK78 pKa = 8.42MQVDD82 pKa = 3.97HH83 pKa = 6.93LCNNRR88 pKa = 11.84LCCNPEE94 pKa = 3.64HH95 pKa = 6.89LEE97 pKa = 4.37LVTHH101 pKa = 6.2QEE103 pKa = 3.88NQRR106 pKa = 11.84RR107 pKa = 11.84RR108 pKa = 11.84AKK110 pKa = 10.22RR111 pKa = 11.84SKK113 pKa = 10.95SKK115 pKa = 10.9GNKK118 pKa = 8.6
MM1 pKa = 7.18AQEE4 pKa = 3.98KK5 pKa = 10.18NRR7 pKa = 11.84RR8 pKa = 11.84QTLIEE13 pKa = 4.82RR14 pKa = 11.84IQARR18 pKa = 11.84IKK20 pKa = 10.87LQDD23 pKa = 3.26LGYY26 pKa = 8.55TVNGQPSLCHH36 pKa = 6.0IWTGSHH42 pKa = 6.17SGNGRR47 pKa = 11.84GGQYY51 pKa = 11.06GRR53 pKa = 11.84ISVNGVTSATHH64 pKa = 6.33IIAYY68 pKa = 5.27THH70 pKa = 4.68YY71 pKa = 10.48HH72 pKa = 6.22GYY74 pKa = 9.71IPNKK78 pKa = 8.42MQVDD82 pKa = 3.97HH83 pKa = 6.93LCNNRR88 pKa = 11.84LCCNPEE94 pKa = 3.64HH95 pKa = 6.89LEE97 pKa = 4.37LVTHH101 pKa = 6.2QEE103 pKa = 3.88NQRR106 pKa = 11.84RR107 pKa = 11.84RR108 pKa = 11.84AKK110 pKa = 10.22RR111 pKa = 11.84SKK113 pKa = 10.95SKK115 pKa = 10.9GNKK118 pKa = 8.6
Molecular weight: 13.48 kDa
Isoelectric point according different methods:
Peptides (in silico digests for buttom-up proteomics)
Below you can find in silico digests of the whole proteome with Trypsin, Chymotrypsin, Trypsin+LysC, LysN, ArgC proteases suitable for different mass spec machines.| Try ESI |
 |
|---|
| ChTry ESI |
 |
|---|
| ArgC ESI |
 |
|---|
| LysN ESI |
 |
|---|
| TryLysC ESI |
 |
|---|
| Try MALDI |
 |
|---|
| ChTry MALDI |
 |
|---|
| ArgC MALDI |
 |
|---|
| LysN MALDI |
 |
|---|
| TryLysC MALDI |
 |
|---|
| Try LTQ |
 |
|---|
| ChTry LTQ |
 |
|---|
| ArgC LTQ |
 |
|---|
| LysN LTQ |
 |
|---|
| TryLysC LTQ |
 |
|---|
| Try MSlow |
 |
|---|
| ChTry MSlow |
 |
|---|
| ArgC MSlow |
 |
|---|
| LysN MSlow |
 |
|---|
| TryLysC MSlow |
 |
|---|
| Try MShigh |
 |
|---|
| ChTry MShigh |
 |
|---|
| ArgC MShigh |
 |
|---|
| LysN MShigh |
 |
|---|
| TryLysC MShigh |
 |
|---|
General Statistics
Number of major isoforms |
Number of additional isoforms |
Number of all proteins |
Number of amino acids |
Min. Seq. Length |
Max. Seq. Length |
Avg. Seq. Length |
Avg. Mol. Weight |
|---|---|---|---|---|---|---|---|
0 |
22029 |
42 |
3500 |
306.0 |
34.2 |
Amino acid frequency
Ala |
Cys |
Asp |
Glu |
Phe |
Gly |
His |
Ile |
Lys |
Leu |
|---|---|---|---|---|---|---|---|---|---|
8.475 ± 0.545 | 0.922 ± 0.173 |
5.824 ± 0.154 | 6.532 ± 0.256 |
3.545 ± 0.187 | 6.401 ± 0.229 |
1.879 ± 0.165 | 5.983 ± 0.194 |
6.7 ± 0.279 | 8.239 ± 0.283 |
Met |
Asn |
Gln |
Pro |
Arg |
Ser |
Thr |
Val |
Trp |
Tyr |
|---|---|---|---|---|---|---|---|---|---|
2.978 ± 0.1 | 5.588 ± 0.18 |
4.104 ± 0.186 | 4.372 ± 0.293 |
4.312 ± 0.179 | 5.774 ± 0.237 |
6.573 ± 0.247 | 6.818 ± 0.216 |
1.316 ± 0.194 | 3.663 ± 0.248 |
Most of the basic statistics you can see at this page can be downloaded from this CSV file
Proteome-pI is available under Creative Commons Attribution-NoDerivs license, for more details see here
| Reference: Kozlowski LP. Proteome-pI 2.0: Proteome Isoelectric Point Database Update. Nucleic Acids Res. 2021, doi: 10.1093/nar/gkab944 | Contact: Lukasz P. Kozlowski |
