Streptomyces phage Rima
Taxonomy: Viruses; Duplodnaviria; Heunggongvirae; Uroviricota; Caudoviricetes; Caudovirales; Siphoviridae; Rimavirus; Strepomyces virus Rima
Average proteome isoelectric point is 6.32
Get precalculated fractions of proteins

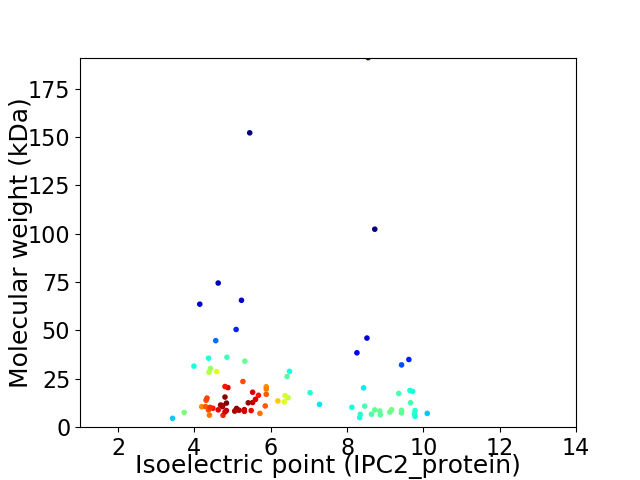
Virtual 2D-PAGE plot for 87 proteins (isoelectric point calculated using IPC2_protein)
Get csv file with sequences according to given criteria:
* You can choose from 21 different methods for calculating isoelectric point
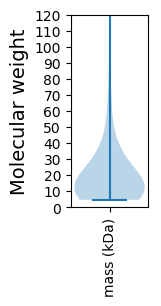
Summary statistics related to proteome-wise predictions


Protein with the lowest isoelectric point:
>tr|A0A1I9SDP5|A0A1I9SDP5_9CAUD Uncharacterized protein OS=Streptomyces phage Rima OX=1897525 GN=18 PE=4 SV=1
MM1 pKa = 7.24TQLTWDD7 pKa = 3.45KK8 pKa = 11.14SGEE11 pKa = 4.07RR12 pKa = 11.84YY13 pKa = 9.81YY14 pKa = 10.45EE15 pKa = 3.85TGVDD19 pKa = 3.65HH20 pKa = 6.89GVLYY24 pKa = 10.48IPNSQGDD31 pKa = 4.07YY32 pKa = 8.79TSGYY36 pKa = 9.07AWNGLTTVTEE46 pKa = 4.44SPSGAEE52 pKa = 4.33SNPQYY57 pKa = 11.32ADD59 pKa = 3.31NIKK62 pKa = 10.1YY63 pKa = 10.68LNLISAEE70 pKa = 4.08EE71 pKa = 3.89FGGTIEE77 pKa = 4.71AFTYY81 pKa = 10.2PDD83 pKa = 3.98EE84 pKa = 5.39FGQCDD89 pKa = 3.72GTAAPTPGVLVGQQSRR105 pKa = 11.84KK106 pKa = 7.76TFGLSYY112 pKa = 9.42RR113 pKa = 11.84TKK115 pKa = 10.7LGNDD119 pKa = 3.95LDD121 pKa = 4.55GQDD124 pKa = 4.02HH125 pKa = 7.09GYY127 pKa = 10.58KK128 pKa = 10.3LHH130 pKa = 6.48LVYY133 pKa = 10.45GALAAPSEE141 pKa = 4.28KK142 pKa = 10.51AYY144 pKa = 9.79ATVNDD149 pKa = 4.08SPEE152 pKa = 4.78AITFSWEE159 pKa = 3.78FTTTPVEE166 pKa = 4.21VGQIAGVDD174 pKa = 3.7YY175 pKa = 10.95KK176 pKa = 10.33PTATLTIDD184 pKa = 3.51STKK187 pKa = 10.49VDD189 pKa = 3.76AGALDD194 pKa = 3.67TLEE197 pKa = 4.08EE198 pKa = 4.13FLYY201 pKa = 9.09GTEE204 pKa = 4.23GTDD207 pKa = 3.99PSLPDD212 pKa = 4.04PATVIAMFSGTVLEE226 pKa = 4.44ATPTEE231 pKa = 4.16PSYY234 pKa = 11.5DD235 pKa = 3.47AATDD239 pKa = 4.19TITIPTVTGVNYY251 pKa = 10.58YY252 pKa = 10.04IGGEE256 pKa = 4.07LQAPGPVIISEE267 pKa = 4.15DD268 pKa = 3.98TIVEE272 pKa = 3.87ARR274 pKa = 11.84PAKK277 pKa = 10.23GYY279 pKa = 10.35KK280 pKa = 10.01FPANVDD286 pKa = 3.55NDD288 pKa = 3.75WLITYY293 pKa = 8.72SS294 pKa = 3.4
MM1 pKa = 7.24TQLTWDD7 pKa = 3.45KK8 pKa = 11.14SGEE11 pKa = 4.07RR12 pKa = 11.84YY13 pKa = 9.81YY14 pKa = 10.45EE15 pKa = 3.85TGVDD19 pKa = 3.65HH20 pKa = 6.89GVLYY24 pKa = 10.48IPNSQGDD31 pKa = 4.07YY32 pKa = 8.79TSGYY36 pKa = 9.07AWNGLTTVTEE46 pKa = 4.44SPSGAEE52 pKa = 4.33SNPQYY57 pKa = 11.32ADD59 pKa = 3.31NIKK62 pKa = 10.1YY63 pKa = 10.68LNLISAEE70 pKa = 4.08EE71 pKa = 3.89FGGTIEE77 pKa = 4.71AFTYY81 pKa = 10.2PDD83 pKa = 3.98EE84 pKa = 5.39FGQCDD89 pKa = 3.72GTAAPTPGVLVGQQSRR105 pKa = 11.84KK106 pKa = 7.76TFGLSYY112 pKa = 9.42RR113 pKa = 11.84TKK115 pKa = 10.7LGNDD119 pKa = 3.95LDD121 pKa = 4.55GQDD124 pKa = 4.02HH125 pKa = 7.09GYY127 pKa = 10.58KK128 pKa = 10.3LHH130 pKa = 6.48LVYY133 pKa = 10.45GALAAPSEE141 pKa = 4.28KK142 pKa = 10.51AYY144 pKa = 9.79ATVNDD149 pKa = 4.08SPEE152 pKa = 4.78AITFSWEE159 pKa = 3.78FTTTPVEE166 pKa = 4.21VGQIAGVDD174 pKa = 3.7YY175 pKa = 10.95KK176 pKa = 10.33PTATLTIDD184 pKa = 3.51STKK187 pKa = 10.49VDD189 pKa = 3.76AGALDD194 pKa = 3.67TLEE197 pKa = 4.08EE198 pKa = 4.13FLYY201 pKa = 9.09GTEE204 pKa = 4.23GTDD207 pKa = 3.99PSLPDD212 pKa = 4.04PATVIAMFSGTVLEE226 pKa = 4.44ATPTEE231 pKa = 4.16PSYY234 pKa = 11.5DD235 pKa = 3.47AATDD239 pKa = 4.19TITIPTVTGVNYY251 pKa = 10.58YY252 pKa = 10.04IGGEE256 pKa = 4.07LQAPGPVIISEE267 pKa = 4.15DD268 pKa = 3.98TIVEE272 pKa = 3.87ARR274 pKa = 11.84PAKK277 pKa = 10.23GYY279 pKa = 10.35KK280 pKa = 10.01FPANVDD286 pKa = 3.55NDD288 pKa = 3.75WLITYY293 pKa = 8.72SS294 pKa = 3.4
Molecular weight: 31.56 kDa
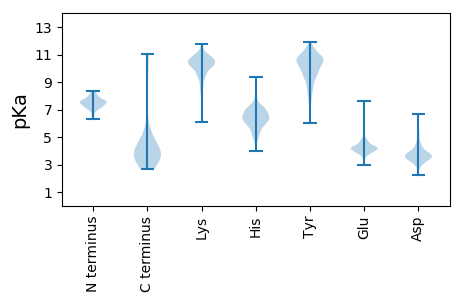
Isoelectric point according different methods:
Protein with the highest isoelectric point:
>tr|A0A1I9SDU9|A0A1I9SDU9_9CAUD Uncharacterized protein OS=Streptomyces phage Rima OX=1897525 GN=74 PE=4 SV=1
MM1 pKa = 7.2EE2 pKa = 4.39TFISNFNWLWTYY14 pKa = 10.78LVIIGAAFAILGVWKK29 pKa = 10.46LIDD32 pKa = 4.37EE33 pKa = 4.23IRR35 pKa = 11.84LYY37 pKa = 8.92TEE39 pKa = 3.41RR40 pKa = 11.84RR41 pKa = 11.84RR42 pKa = 11.84YY43 pKa = 9.29RR44 pKa = 11.84RR45 pKa = 11.84ARR47 pKa = 11.84AEE49 pKa = 3.9RR50 pKa = 11.84TGATWAKK57 pKa = 10.05KK58 pKa = 8.58STGEE62 pKa = 3.69ISAGSLRR69 pKa = 11.84SSGEE73 pKa = 3.75RR74 pKa = 3.3
MM1 pKa = 7.2EE2 pKa = 4.39TFISNFNWLWTYY14 pKa = 10.78LVIIGAAFAILGVWKK29 pKa = 10.46LIDD32 pKa = 4.37EE33 pKa = 4.23IRR35 pKa = 11.84LYY37 pKa = 8.92TEE39 pKa = 3.41RR40 pKa = 11.84RR41 pKa = 11.84RR42 pKa = 11.84YY43 pKa = 9.29RR44 pKa = 11.84RR45 pKa = 11.84ARR47 pKa = 11.84AEE49 pKa = 3.9RR50 pKa = 11.84TGATWAKK57 pKa = 10.05KK58 pKa = 8.58STGEE62 pKa = 3.69ISAGSLRR69 pKa = 11.84SSGEE73 pKa = 3.75RR74 pKa = 3.3
Molecular weight: 8.6 kDa
Isoelectric point according different methods:
Peptides (in silico digests for buttom-up proteomics)
Below you can find in silico digests of the whole proteome with Trypsin, Chymotrypsin, Trypsin+LysC, LysN, ArgC proteases suitable for different mass spec machines.| Try ESI |
 |
|---|
| ChTry ESI |
 |
|---|
| ArgC ESI |
 |
|---|
| LysN ESI |
 |
|---|
| TryLysC ESI |
 |
|---|
| Try MALDI |
 |
|---|
| ChTry MALDI |
 |
|---|
| ArgC MALDI |
 |
|---|
| LysN MALDI |
 |
|---|
| TryLysC MALDI |
 |
|---|
| Try LTQ |
 |
|---|
| ChTry LTQ |
 |
|---|
| ArgC LTQ |
 |
|---|
| LysN LTQ |
 |
|---|
| TryLysC LTQ |
 |
|---|
| Try MSlow |
 |
|---|
| ChTry MSlow |
 |
|---|
| ArgC MSlow |
 |
|---|
| LysN MSlow |
 |
|---|
| TryLysC MSlow |
 |
|---|
| Try MShigh |
 |
|---|
| ChTry MShigh |
 |
|---|
| ArgC MShigh |
 |
|---|
| LysN MShigh |
 |
|---|
| TryLysC MShigh |
 |
|---|
General Statistics
Number of major isoforms |
Number of additional isoforms |
Number of all proteins |
Number of amino acids |
Min. Seq. Length |
Max. Seq. Length |
Avg. Seq. Length |
Avg. Mol. Weight |
|---|---|---|---|---|---|---|---|
0 |
17478 |
43 |
1828 |
200.9 |
22.34 |
Amino acid frequency
Ala |
Cys |
Asp |
Glu |
Phe |
Gly |
His |
Ile |
Lys |
Leu |
|---|---|---|---|---|---|---|---|---|---|
9.131 ± 0.485 | 0.572 ± 0.118 |
6.271 ± 0.272 | 7.404 ± 0.387 |
3.587 ± 0.198 | 7.369 ± 0.47 |
1.859 ± 0.192 | 5.292 ± 0.192 |
6.957 ± 0.436 | 7.924 ± 0.456 |
Met |
Asn |
Gln |
Pro |
Arg |
Ser |
Thr |
Val |
Trp |
Tyr |
|---|---|---|---|---|---|---|---|---|---|
2.763 ± 0.148 | 4.011 ± 0.177 |
4.137 ± 0.275 | 3.33 ± 0.155 |
5.104 ± 0.353 | 6.03 ± 0.287 |
6.557 ± 0.307 | 6.929 ± 0.201 |
1.448 ± 0.148 | 3.324 ± 0.281 |
Most of the basic statistics you can see at this page can be downloaded from this CSV file
Proteome-pI is available under Creative Commons Attribution-NoDerivs license, for more details see here
| Reference: Kozlowski LP. Proteome-pI 2.0: Proteome Isoelectric Point Database Update. Nucleic Acids Res. 2021, doi: 10.1093/nar/gkab944 | Contact: Lukasz P. Kozlowski |
