Equus caballus papillomavirus 1 (strain Olson) (EcPV-1)
Taxonomy: Viruses; Monodnaviria; Shotokuvirae; Cossaviricota; Papovaviricetes; Zurhausenvirales; Papillomaviridae; Firstpapillomavirinae; Zetapapillomavirus; Zetapapillomavirus 1; Equus caballus papillomavirus 1
Average proteome isoelectric point is 6.42
Get precalculated fractions of proteins

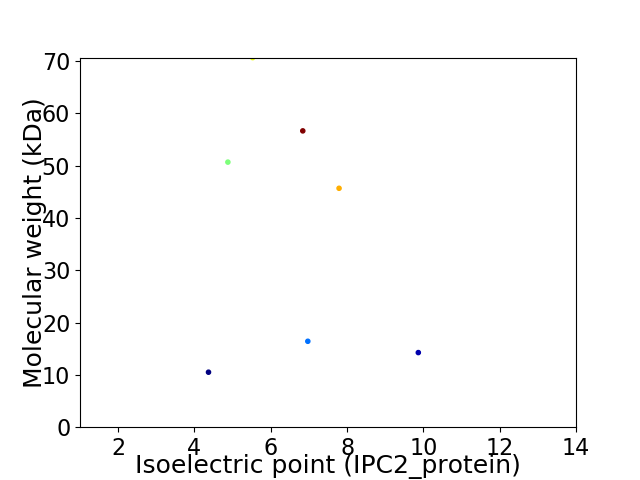
Virtual 2D-PAGE plot for 7 proteins (isoelectric point calculated using IPC2_protein)
Get csv file with sequences according to given criteria:
* You can choose from 21 different methods for calculating isoelectric point
Summary statistics related to proteome-wise predictions


Protein with the lowest isoelectric point:
>tr|Q8QQC2|Q8QQC2_ECPVO Protein E6 OS=Equus caballus papillomavirus 1 (strain Olson) OX=654918 GN=E6 PE=3 SV=1
MM1 pKa = 7.66IGNGSPSLRR10 pKa = 11.84EE11 pKa = 3.71IVLSEE16 pKa = 4.4LPQSLADD23 pKa = 3.64PAEE26 pKa = 4.43AEE28 pKa = 4.24SEE30 pKa = 4.2EE31 pKa = 4.48EE32 pKa = 4.04EE33 pKa = 5.03VEE35 pKa = 4.29VEE37 pKa = 3.95LDD39 pKa = 3.34AVRR42 pKa = 11.84PQAPYY47 pKa = 10.4AVCTVCCRR55 pKa = 11.84CGEE58 pKa = 4.17KK59 pKa = 10.62VGLCVLATDD68 pKa = 4.21EE69 pKa = 5.31GIHH72 pKa = 6.0GLEE75 pKa = 3.84EE76 pKa = 4.25LLFEE80 pKa = 4.98ALQLFCAQCAPPIGRR95 pKa = 11.84HH96 pKa = 4.7GRR98 pKa = 3.45
MM1 pKa = 7.66IGNGSPSLRR10 pKa = 11.84EE11 pKa = 3.71IVLSEE16 pKa = 4.4LPQSLADD23 pKa = 3.64PAEE26 pKa = 4.43AEE28 pKa = 4.24SEE30 pKa = 4.2EE31 pKa = 4.48EE32 pKa = 4.04EE33 pKa = 5.03VEE35 pKa = 4.29VEE37 pKa = 3.95LDD39 pKa = 3.34AVRR42 pKa = 11.84PQAPYY47 pKa = 10.4AVCTVCCRR55 pKa = 11.84CGEE58 pKa = 4.17KK59 pKa = 10.62VGLCVLATDD68 pKa = 4.21EE69 pKa = 5.31GIHH72 pKa = 6.0GLEE75 pKa = 3.84EE76 pKa = 4.25LLFEE80 pKa = 4.98ALQLFCAQCAPPIGRR95 pKa = 11.84HH96 pKa = 4.7GRR98 pKa = 3.45
Molecular weight: 10.51 kDa
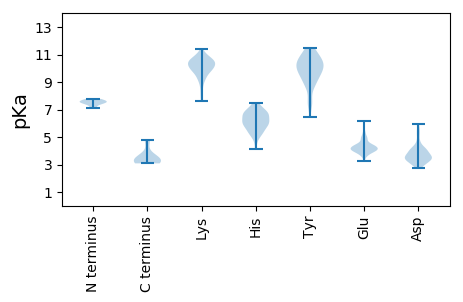
Isoelectric point according different methods:
Protein with the highest isoelectric point:
>tr|Q8QQB9|Q8QQB9_ECPVO Regulatory protein E2 OS=Equus caballus papillomavirus 1 (strain Olson) OX=654918 GN=E2 PE=3 SV=1
PP1 pKa = 7.59ALRR4 pKa = 11.84LSLHH8 pKa = 5.85LTSTSLTEE16 pKa = 3.97QQEE19 pKa = 3.78EE20 pKa = 4.14DD21 pKa = 4.08LINRR25 pKa = 11.84LGLEE29 pKa = 3.94PWQCRR34 pKa = 11.84LRR36 pKa = 11.84SPQKK40 pKa = 10.5RR41 pKa = 11.84GTALQLTQSAALGCQGGSAAQPTGAAGSYY70 pKa = 8.72NARR73 pKa = 11.84LPPPGCRR80 pKa = 11.84RR81 pKa = 11.84RR82 pKa = 11.84YY83 pKa = 9.31RR84 pKa = 11.84KK85 pKa = 9.22YY86 pKa = 10.03LKK88 pKa = 10.05RR89 pKa = 11.84RR90 pKa = 11.84RR91 pKa = 11.84DD92 pKa = 3.12QYY94 pKa = 11.34RR95 pKa = 11.84RR96 pKa = 11.84LGEE99 pKa = 4.01HH100 pKa = 5.75LQEE103 pKa = 6.13LIQQLDD109 pKa = 3.46GGTTPRR115 pKa = 11.84PYY117 pKa = 9.97HH118 pKa = 5.37WRR120 pKa = 11.84LRR122 pKa = 11.84SPQQ125 pKa = 3.18
PP1 pKa = 7.59ALRR4 pKa = 11.84LSLHH8 pKa = 5.85LTSTSLTEE16 pKa = 3.97QQEE19 pKa = 3.78EE20 pKa = 4.14DD21 pKa = 4.08LINRR25 pKa = 11.84LGLEE29 pKa = 3.94PWQCRR34 pKa = 11.84LRR36 pKa = 11.84SPQKK40 pKa = 10.5RR41 pKa = 11.84GTALQLTQSAALGCQGGSAAQPTGAAGSYY70 pKa = 8.72NARR73 pKa = 11.84LPPPGCRR80 pKa = 11.84RR81 pKa = 11.84RR82 pKa = 11.84YY83 pKa = 9.31RR84 pKa = 11.84KK85 pKa = 9.22YY86 pKa = 10.03LKK88 pKa = 10.05RR89 pKa = 11.84RR90 pKa = 11.84RR91 pKa = 11.84DD92 pKa = 3.12QYY94 pKa = 11.34RR95 pKa = 11.84RR96 pKa = 11.84LGEE99 pKa = 4.01HH100 pKa = 5.75LQEE103 pKa = 6.13LIQQLDD109 pKa = 3.46GGTTPRR115 pKa = 11.84PYY117 pKa = 9.97HH118 pKa = 5.37WRR120 pKa = 11.84LRR122 pKa = 11.84SPQQ125 pKa = 3.18
Molecular weight: 14.26 kDa
Isoelectric point according different methods:
Peptides (in silico digests for buttom-up proteomics)
Below you can find in silico digests of the whole proteome with Trypsin, Chymotrypsin, Trypsin+LysC, LysN, ArgC proteases suitable for different mass spec machines.| Try ESI |
 |
|---|
| ChTry ESI |
 |
|---|
| ArgC ESI |
 |
|---|
| LysN ESI |
 |
|---|
| TryLysC ESI |
 |
|---|
| Try MALDI |
 |
|---|
| ChTry MALDI |
 |
|---|
| ArgC MALDI |
 |
|---|
| LysN MALDI |
 |
|---|
| TryLysC MALDI |
 |
|---|
| Try LTQ |
 |
|---|
| ChTry LTQ |
 |
|---|
| ArgC LTQ |
 |
|---|
| LysN LTQ |
 |
|---|
| TryLysC LTQ |
 |
|---|
| Try MSlow |
 |
|---|
| ChTry MSlow |
 |
|---|
| ArgC MSlow |
 |
|---|
| LysN MSlow |
 |
|---|
| TryLysC MSlow |
 |
|---|
| Try MShigh |
 |
|---|
| ChTry MShigh |
 |
|---|
| ArgC MShigh |
 |
|---|
| LysN MShigh |
 |
|---|
| TryLysC MShigh |
 |
|---|
General Statistics
Number of major isoforms |
Number of additional isoforms |
Number of all proteins |
Number of amino acids |
Min. Seq. Length |
Max. Seq. Length |
Avg. Seq. Length |
Avg. Mol. Weight |
|---|---|---|---|---|---|---|---|
0 |
2372 |
98 |
620 |
338.9 |
37.82 |
Amino acid frequency
Ala |
Cys |
Asp |
Glu |
Phe |
Gly |
His |
Ile |
Lys |
Leu |
|---|---|---|---|---|---|---|---|---|---|
6.45 ± 0.525 | 2.234 ± 0.672 |
5.523 ± 0.568 | 6.282 ± 0.607 |
3.626 ± 0.591 | 7.884 ± 1.127 |
2.024 ± 0.122 | 3.583 ± 0.323 |
3.836 ± 0.732 | 9.106 ± 0.613 |
Met |
Asn |
Gln |
Pro |
Arg |
Ser |
Thr |
Val |
Trp |
Tyr |
|---|---|---|---|---|---|---|---|---|---|
1.855 ± 0.247 | 3.668 ± 0.69 |
7.125 ± 0.73 | 4.511 ± 0.715 |
7.083 ± 0.63 | 7.42 ± 0.763 |
5.776 ± 0.545 | 6.914 ± 0.664 |
1.939 ± 0.344 | 3.162 ± 0.256 |
Most of the basic statistics you can see at this page can be downloaded from this CSV file
Proteome-pI is available under Creative Commons Attribution-NoDerivs license, for more details see here
| Reference: Kozlowski LP. Proteome-pI 2.0: Proteome Isoelectric Point Database Update. Nucleic Acids Res. 2021, doi: 10.1093/nar/gkab944 | Contact: Lukasz P. Kozlowski |
