Pseudorhizobium banfieldiae
Taxonomy: cellular organisms; Bacteria; Proteobacteria; Alphaproteobacteria; Hyphomicrobiales; Rhizobiaceae; Rhizobium/Agrobacterium group; Pseudorhizobium
Average proteome isoelectric point is 6.45
Get precalculated fractions of proteins

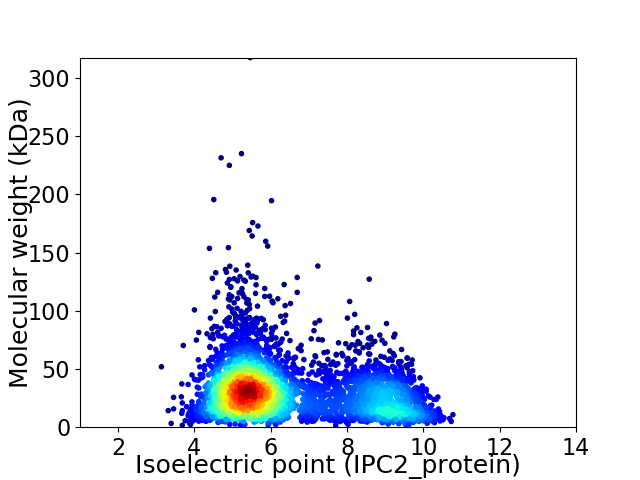
Virtual 2D-PAGE plot for 4603 proteins (isoelectric point calculated using IPC2_protein)
Get csv file with sequences according to given criteria:
* You can choose from 21 different methods for calculating isoelectric point
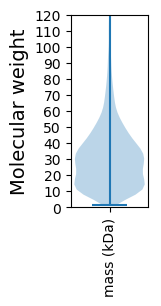
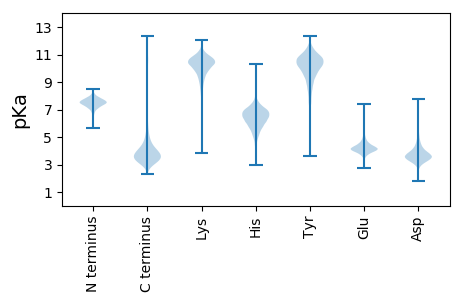
Summary statistics related to proteome-wise predictions


Protein with the lowest isoelectric point:
>tr|L0NCR7|L0NCR7_9RHIZ 3-oxoacyl-[acyl-carrier-protein] synthase 2 OS=Pseudorhizobium banfieldiae OX=1125847 GN=fabF PE=3 SV=1
MM1 pKa = 7.49NIKK4 pKa = 10.39SLLLGSAAALAAVSGAQAADD24 pKa = 4.11AIIAAEE30 pKa = 4.42PEE32 pKa = 3.69PMEE35 pKa = 4.1YY36 pKa = 10.8VRR38 pKa = 11.84VCDD41 pKa = 4.42AFGTGYY47 pKa = 10.47FYY49 pKa = 10.57IPGTEE54 pKa = 3.83TCLKK58 pKa = 9.33IGGYY62 pKa = 9.13VRR64 pKa = 11.84FQVDD68 pKa = 4.02FDD70 pKa = 4.27SRR72 pKa = 11.84DD73 pKa = 3.04GAYY76 pKa = 10.31ADD78 pKa = 5.15DD79 pKa = 5.51NWDD82 pKa = 2.43AWTRR86 pKa = 11.84GRR88 pKa = 11.84VDD90 pKa = 4.03FTAKK94 pKa = 10.33SDD96 pKa = 3.87TEE98 pKa = 4.27LGEE101 pKa = 3.97LTGFIAIQAEE111 pKa = 4.18ASDD114 pKa = 4.41YY115 pKa = 10.6PAATGSTGDD124 pKa = 3.48FYY126 pKa = 11.5FDD128 pKa = 3.34EE129 pKa = 5.54VYY131 pKa = 10.82LQLGGFKK138 pKa = 10.6AGTYY142 pKa = 9.78LNWWDD147 pKa = 3.62KK148 pKa = 11.15GINGEE153 pKa = 4.23TDD155 pKa = 3.07SLGATTRR162 pKa = 11.84MTSIAYY168 pKa = 9.31IYY170 pKa = 10.37TGDD173 pKa = 3.76AFTAGLQLDD182 pKa = 3.93EE183 pKa = 4.56LTNVEE188 pKa = 4.36LGGGGGQDD196 pKa = 3.5FGLEE200 pKa = 4.28AIVTASLGAASVDD213 pKa = 3.71LLGSYY218 pKa = 10.86DD219 pKa = 3.6FANEE223 pKa = 3.94DD224 pKa = 3.45GAVRR228 pKa = 11.84ALVSAGIGPGTLQLAGVWASGYY250 pKa = 9.52NVYY253 pKa = 11.02YY254 pKa = 10.43NASEE258 pKa = 3.9WTIAASYY265 pKa = 10.26SFKK268 pKa = 10.73ATDD271 pKa = 3.99KK272 pKa = 10.21FTITPGVQYY281 pKa = 10.06FSNVDD286 pKa = 3.52LDD288 pKa = 4.83GDD290 pKa = 4.74DD291 pKa = 5.38FDD293 pKa = 7.21GDD295 pKa = 4.15DD296 pKa = 3.36AWRR299 pKa = 11.84AGLTVDD305 pKa = 3.69YY306 pKa = 10.64AITSGLAMKK315 pKa = 10.56VSAQWNDD322 pKa = 2.76GNRR325 pKa = 11.84RR326 pKa = 11.84GAGDD330 pKa = 3.63EE331 pKa = 4.54DD332 pKa = 4.28YY333 pKa = 10.92WDD335 pKa = 3.61GFVRR339 pKa = 11.84LQRR342 pKa = 11.84SFF344 pKa = 3.42
MM1 pKa = 7.49NIKK4 pKa = 10.39SLLLGSAAALAAVSGAQAADD24 pKa = 4.11AIIAAEE30 pKa = 4.42PEE32 pKa = 3.69PMEE35 pKa = 4.1YY36 pKa = 10.8VRR38 pKa = 11.84VCDD41 pKa = 4.42AFGTGYY47 pKa = 10.47FYY49 pKa = 10.57IPGTEE54 pKa = 3.83TCLKK58 pKa = 9.33IGGYY62 pKa = 9.13VRR64 pKa = 11.84FQVDD68 pKa = 4.02FDD70 pKa = 4.27SRR72 pKa = 11.84DD73 pKa = 3.04GAYY76 pKa = 10.31ADD78 pKa = 5.15DD79 pKa = 5.51NWDD82 pKa = 2.43AWTRR86 pKa = 11.84GRR88 pKa = 11.84VDD90 pKa = 4.03FTAKK94 pKa = 10.33SDD96 pKa = 3.87TEE98 pKa = 4.27LGEE101 pKa = 3.97LTGFIAIQAEE111 pKa = 4.18ASDD114 pKa = 4.41YY115 pKa = 10.6PAATGSTGDD124 pKa = 3.48FYY126 pKa = 11.5FDD128 pKa = 3.34EE129 pKa = 5.54VYY131 pKa = 10.82LQLGGFKK138 pKa = 10.6AGTYY142 pKa = 9.78LNWWDD147 pKa = 3.62KK148 pKa = 11.15GINGEE153 pKa = 4.23TDD155 pKa = 3.07SLGATTRR162 pKa = 11.84MTSIAYY168 pKa = 9.31IYY170 pKa = 10.37TGDD173 pKa = 3.76AFTAGLQLDD182 pKa = 3.93EE183 pKa = 4.56LTNVEE188 pKa = 4.36LGGGGGQDD196 pKa = 3.5FGLEE200 pKa = 4.28AIVTASLGAASVDD213 pKa = 3.71LLGSYY218 pKa = 10.86DD219 pKa = 3.6FANEE223 pKa = 3.94DD224 pKa = 3.45GAVRR228 pKa = 11.84ALVSAGIGPGTLQLAGVWASGYY250 pKa = 9.52NVYY253 pKa = 11.02YY254 pKa = 10.43NASEE258 pKa = 3.9WTIAASYY265 pKa = 10.26SFKK268 pKa = 10.73ATDD271 pKa = 3.99KK272 pKa = 10.21FTITPGVQYY281 pKa = 10.06FSNVDD286 pKa = 3.52LDD288 pKa = 4.83GDD290 pKa = 4.74DD291 pKa = 5.38FDD293 pKa = 7.21GDD295 pKa = 4.15DD296 pKa = 3.36AWRR299 pKa = 11.84AGLTVDD305 pKa = 3.69YY306 pKa = 10.64AITSGLAMKK315 pKa = 10.56VSAQWNDD322 pKa = 2.76GNRR325 pKa = 11.84RR326 pKa = 11.84GAGDD330 pKa = 3.63EE331 pKa = 4.54DD332 pKa = 4.28YY333 pKa = 10.92WDD335 pKa = 3.61GFVRR339 pKa = 11.84LQRR342 pKa = 11.84SFF344 pKa = 3.42
Molecular weight: 36.7 kDa
Isoelectric point according different methods:
Protein with the highest isoelectric point:
>tr|L0NLI9|L0NLI9_9RHIZ N-acetyltransferase domain-containing protein OS=Pseudorhizobium banfieldiae OX=1125847 GN=NT26_4047 PE=4 SV=1
MM1 pKa = 6.75PTCGRR6 pKa = 11.84CLATRR11 pKa = 11.84LRR13 pKa = 11.84CRR15 pKa = 11.84RR16 pKa = 11.84LKK18 pKa = 10.22PLPPRR23 pKa = 11.84VKK25 pKa = 10.38PLLPLLKK32 pKa = 10.56VLLLRR37 pKa = 11.84RR38 pKa = 11.84KK39 pKa = 9.59LLLRR43 pKa = 11.84RR44 pKa = 11.84TLLPLAKK51 pKa = 9.9VKK53 pKa = 10.35PLLRR57 pKa = 11.84PRR59 pKa = 11.84LLPLLLAKK67 pKa = 10.34RR68 pKa = 11.84PQPKK72 pKa = 9.36VQHH75 pKa = 5.93LQPKK79 pKa = 9.46RR80 pKa = 11.84RR81 pKa = 11.84PLLPRR86 pKa = 11.84KK87 pKa = 9.06SQHH90 pKa = 5.32RR91 pKa = 3.73
MM1 pKa = 6.75PTCGRR6 pKa = 11.84CLATRR11 pKa = 11.84LRR13 pKa = 11.84CRR15 pKa = 11.84RR16 pKa = 11.84LKK18 pKa = 10.22PLPPRR23 pKa = 11.84VKK25 pKa = 10.38PLLPLLKK32 pKa = 10.56VLLLRR37 pKa = 11.84RR38 pKa = 11.84KK39 pKa = 9.59LLLRR43 pKa = 11.84RR44 pKa = 11.84TLLPLAKK51 pKa = 9.9VKK53 pKa = 10.35PLLRR57 pKa = 11.84PRR59 pKa = 11.84LLPLLLAKK67 pKa = 10.34RR68 pKa = 11.84PQPKK72 pKa = 9.36VQHH75 pKa = 5.93LQPKK79 pKa = 9.46RR80 pKa = 11.84RR81 pKa = 11.84PLLPRR86 pKa = 11.84KK87 pKa = 9.06SQHH90 pKa = 5.32RR91 pKa = 3.73
Molecular weight: 10.75 kDa
Isoelectric point according different methods:
Peptides (in silico digests for buttom-up proteomics)
Below you can find in silico digests of the whole proteome with Trypsin, Chymotrypsin, Trypsin+LysC, LysN, ArgC proteases suitable for different mass spec machines.| Try ESI |
 |
|---|
| ChTry ESI |
 |
|---|
| ArgC ESI |
 |
|---|
| LysN ESI |
 |
|---|
| TryLysC ESI |
 |
|---|
| Try MALDI |
 |
|---|
| ChTry MALDI |
 |
|---|
| ArgC MALDI |
 |
|---|
| LysN MALDI |
 |
|---|
| TryLysC MALDI |
 |
|---|
| Try LTQ |
 |
|---|
| ChTry LTQ |
 |
|---|
| ArgC LTQ |
 |
|---|
| LysN LTQ |
 |
|---|
| TryLysC LTQ |
 |
|---|
| Try MSlow |
 |
|---|
| ChTry MSlow |
 |
|---|
| ArgC MSlow |
 |
|---|
| LysN MSlow |
 |
|---|
| TryLysC MSlow |
 |
|---|
| Try MShigh |
 |
|---|
| ChTry MShigh |
 |
|---|
| ArgC MShigh |
 |
|---|
| LysN MShigh |
 |
|---|
| TryLysC MShigh |
 |
|---|
General Statistics
Number of major isoforms |
Number of additional isoforms |
Number of all proteins |
Number of amino acids |
Min. Seq. Length |
Max. Seq. Length |
Avg. Seq. Length |
Avg. Mol. Weight |
|---|---|---|---|---|---|---|---|
0 |
1374660 |
12 |
2835 |
298.6 |
32.54 |
Amino acid frequency
Ala |
Cys |
Asp |
Glu |
Phe |
Gly |
His |
Ile |
Lys |
Leu |
|---|---|---|---|---|---|---|---|---|---|
11.794 ± 0.045 | 0.836 ± 0.01 |
5.622 ± 0.027 | 6.162 ± 0.038 |
3.792 ± 0.025 | 8.389 ± 0.032 |
2.047 ± 0.018 | 5.478 ± 0.025 |
3.375 ± 0.036 | 10.083 ± 0.043 |
Met |
Asn |
Gln |
Pro |
Arg |
Ser |
Thr |
Val |
Trp |
Tyr |
|---|---|---|---|---|---|---|---|---|---|
2.663 ± 0.016 | 2.662 ± 0.022 |
4.975 ± 0.026 | 3.165 ± 0.02 |
7.068 ± 0.033 | 5.695 ± 0.024 |
5.253 ± 0.023 | 7.411 ± 0.028 |
1.267 ± 0.015 | 2.264 ± 0.019 |
Most of the basic statistics you can see at this page can be downloaded from this CSV file
Proteome-pI is available under Creative Commons Attribution-NoDerivs license, for more details see here
| Reference: Kozlowski LP. Proteome-pI 2.0: Proteome Isoelectric Point Database Update. Nucleic Acids Res. 2021, doi: 10.1093/nar/gkab944 | Contact: Lukasz P. Kozlowski |
