Vibrio phage Phriendly
Taxonomy: Viruses; Duplodnaviria; Heunggongvirae; Uroviricota; Caudoviricetes; Caudovirales; Podoviridae; unclassified Podoviridae
Average proteome isoelectric point is 6.38
Get precalculated fractions of proteins

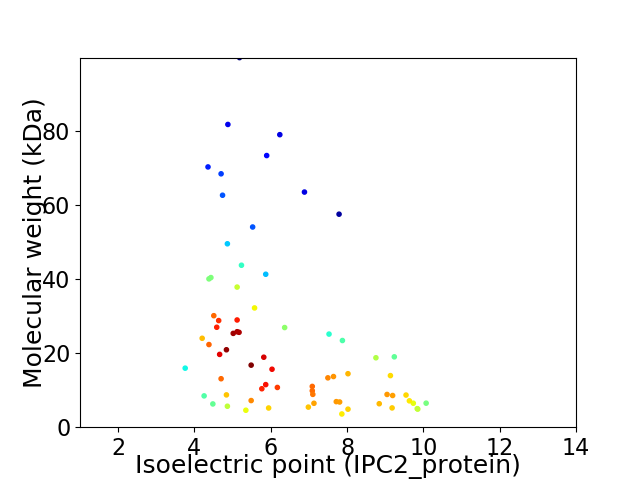
Virtual 2D-PAGE plot for 71 proteins (isoelectric point calculated using IPC2_protein)
Get csv file with sequences according to given criteria:
* You can choose from 21 different methods for calculating isoelectric point
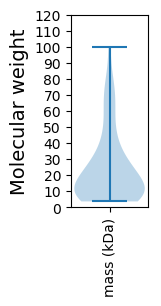
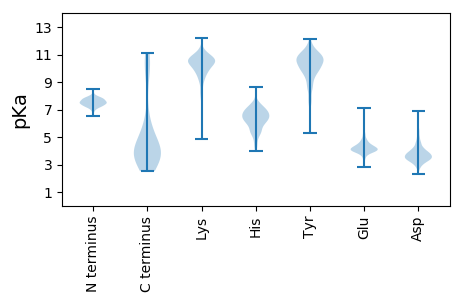
Summary statistics related to proteome-wise predictions


Protein with the lowest isoelectric point:
>tr|A0A5B9N9B1|A0A5B9N9B1_9CAUD Uncharacterized protein OS=Vibrio phage Phriendly OX=2596675 GN=CPT_Phriendly_044 PE=4 SV=1
MM1 pKa = 7.76AIIKK5 pKa = 9.85VITHH9 pKa = 6.48KK10 pKa = 10.71LGNITEE16 pKa = 5.21DD17 pKa = 2.83IHH19 pKa = 8.63VDD21 pKa = 3.3IAAGSCACPICGDD34 pKa = 3.98YY35 pKa = 11.23VDD37 pKa = 5.81LLIDD41 pKa = 3.67EE42 pKa = 5.32DD43 pKa = 4.43GDD45 pKa = 4.04YY46 pKa = 9.63KK47 pKa = 8.53TTCDD51 pKa = 4.83CDD53 pKa = 3.54IDD55 pKa = 5.44DD56 pKa = 4.19YY57 pKa = 11.86VEE59 pKa = 4.44KK60 pKa = 10.89GDD62 pKa = 3.85YY63 pKa = 10.95NDD65 pKa = 4.1MEE67 pKa = 4.71EE68 pKa = 4.53EE69 pKa = 4.27LDD71 pKa = 5.11DD72 pKa = 5.55LRR74 pKa = 11.84DD75 pKa = 4.13DD76 pKa = 3.55YY77 pKa = 12.13GEE79 pKa = 4.09AVKK82 pKa = 10.63EE83 pKa = 3.72RR84 pKa = 11.84DD85 pKa = 3.62NFEE88 pKa = 5.49LEE90 pKa = 3.96VDD92 pKa = 3.84DD93 pKa = 6.9LKK95 pKa = 11.59LQLEE99 pKa = 4.3NLKK102 pKa = 10.74ASYY105 pKa = 9.94EE106 pKa = 4.02ADD108 pKa = 2.99IEE110 pKa = 4.16ALEE113 pKa = 4.46EE114 pKa = 4.16EE115 pKa = 4.81YY116 pKa = 10.45QQKK119 pKa = 8.19ITVRR123 pKa = 11.84DD124 pKa = 4.17GIIDD128 pKa = 3.93DD129 pKa = 5.54LEE131 pKa = 4.2EE132 pKa = 3.72QLAATRR138 pKa = 11.84EE139 pKa = 4.2EE140 pKa = 4.24
MM1 pKa = 7.76AIIKK5 pKa = 9.85VITHH9 pKa = 6.48KK10 pKa = 10.71LGNITEE16 pKa = 5.21DD17 pKa = 2.83IHH19 pKa = 8.63VDD21 pKa = 3.3IAAGSCACPICGDD34 pKa = 3.98YY35 pKa = 11.23VDD37 pKa = 5.81LLIDD41 pKa = 3.67EE42 pKa = 5.32DD43 pKa = 4.43GDD45 pKa = 4.04YY46 pKa = 9.63KK47 pKa = 8.53TTCDD51 pKa = 4.83CDD53 pKa = 3.54IDD55 pKa = 5.44DD56 pKa = 4.19YY57 pKa = 11.86VEE59 pKa = 4.44KK60 pKa = 10.89GDD62 pKa = 3.85YY63 pKa = 10.95NDD65 pKa = 4.1MEE67 pKa = 4.71EE68 pKa = 4.53EE69 pKa = 4.27LDD71 pKa = 5.11DD72 pKa = 5.55LRR74 pKa = 11.84DD75 pKa = 4.13DD76 pKa = 3.55YY77 pKa = 12.13GEE79 pKa = 4.09AVKK82 pKa = 10.63EE83 pKa = 3.72RR84 pKa = 11.84DD85 pKa = 3.62NFEE88 pKa = 5.49LEE90 pKa = 3.96VDD92 pKa = 3.84DD93 pKa = 6.9LKK95 pKa = 11.59LQLEE99 pKa = 4.3NLKK102 pKa = 10.74ASYY105 pKa = 9.94EE106 pKa = 4.02ADD108 pKa = 2.99IEE110 pKa = 4.16ALEE113 pKa = 4.46EE114 pKa = 4.16EE115 pKa = 4.81YY116 pKa = 10.45QQKK119 pKa = 8.19ITVRR123 pKa = 11.84DD124 pKa = 4.17GIIDD128 pKa = 3.93DD129 pKa = 5.54LEE131 pKa = 4.2EE132 pKa = 3.72QLAATRR138 pKa = 11.84EE139 pKa = 4.2EE140 pKa = 4.24
Molecular weight: 15.95 kDa
Isoelectric point according different methods:
Protein with the highest isoelectric point:
>tr|A0A5B9N8I5|A0A5B9N8I5_9CAUD Uncharacterized protein OS=Vibrio phage Phriendly OX=2596675 GN=CPT_Phriendly_013 PE=4 SV=1
MM1 pKa = 7.57ACKK4 pKa = 9.52QVKK7 pKa = 9.89LNRR10 pKa = 11.84KK11 pKa = 7.18MAAKK15 pKa = 10.12ASRR18 pKa = 11.84MTKK21 pKa = 10.17GNEE24 pKa = 4.12SVTGNTDD31 pKa = 3.63RR32 pKa = 11.84IMRR35 pKa = 11.84DD36 pKa = 3.07AEE38 pKa = 4.26NLFHH42 pKa = 7.07RR43 pKa = 11.84SKK45 pKa = 11.01RR46 pKa = 11.84GTIYY50 pKa = 10.69SASCKK55 pKa = 9.59GARR58 pKa = 3.89
MM1 pKa = 7.57ACKK4 pKa = 9.52QVKK7 pKa = 9.89LNRR10 pKa = 11.84KK11 pKa = 7.18MAAKK15 pKa = 10.12ASRR18 pKa = 11.84MTKK21 pKa = 10.17GNEE24 pKa = 4.12SVTGNTDD31 pKa = 3.63RR32 pKa = 11.84IMRR35 pKa = 11.84DD36 pKa = 3.07AEE38 pKa = 4.26NLFHH42 pKa = 7.07RR43 pKa = 11.84SKK45 pKa = 11.01RR46 pKa = 11.84GTIYY50 pKa = 10.69SASCKK55 pKa = 9.59GARR58 pKa = 3.89
Molecular weight: 6.48 kDa
Isoelectric point according different methods:
Peptides (in silico digests for buttom-up proteomics)
Below you can find in silico digests of the whole proteome with Trypsin, Chymotrypsin, Trypsin+LysC, LysN, ArgC proteases suitable for different mass spec machines.| Try ESI |
 |
|---|
| ChTry ESI |
 |
|---|
| ArgC ESI |
 |
|---|
| LysN ESI |
 |
|---|
| TryLysC ESI |
 |
|---|
| Try MALDI |
 |
|---|
| ChTry MALDI |
 |
|---|
| ArgC MALDI |
 |
|---|
| LysN MALDI |
 |
|---|
| TryLysC MALDI |
 |
|---|
| Try LTQ |
 |
|---|
| ChTry LTQ |
 |
|---|
| ArgC LTQ |
 |
|---|
| LysN LTQ |
 |
|---|
| TryLysC LTQ |
 |
|---|
| Try MSlow |
 |
|---|
| ChTry MSlow |
 |
|---|
| ArgC MSlow |
 |
|---|
| LysN MSlow |
 |
|---|
| TryLysC MSlow |
 |
|---|
| Try MShigh |
 |
|---|
| ChTry MShigh |
 |
|---|
| ArgC MShigh |
 |
|---|
| LysN MShigh |
 |
|---|
| TryLysC MShigh |
 |
|---|
General Statistics
Number of major isoforms |
Number of additional isoforms |
Number of all proteins |
Number of amino acids |
Min. Seq. Length |
Max. Seq. Length |
Avg. Seq. Length |
Avg. Mol. Weight |
|---|---|---|---|---|---|---|---|
0 |
15442 |
34 |
919 |
217.5 |
24.41 |
Amino acid frequency
Ala |
Cys |
Asp |
Glu |
Phe |
Gly |
His |
Ile |
Lys |
Leu |
|---|---|---|---|---|---|---|---|---|---|
7.959 ± 0.391 | 1.179 ± 0.149 |
6.605 ± 0.201 | 7.169 ± 0.411 |
3.685 ± 0.206 | 7.486 ± 0.374 |
2.111 ± 0.173 | 5.569 ± 0.211 |
7.026 ± 0.37 | 7.68 ± 0.295 |
Met |
Asn |
Gln |
Pro |
Arg |
Ser |
Thr |
Val |
Trp |
Tyr |
|---|---|---|---|---|---|---|---|---|---|
3.044 ± 0.133 | 5.563 ± 0.22 |
3.549 ± 0.204 | 3.983 ± 0.256 |
4.527 ± 0.189 | 5.479 ± 0.3 |
5.589 ± 0.244 | 6.495 ± 0.186 |
1.574 ± 0.152 | 3.73 ± 0.149 |
Most of the basic statistics you can see at this page can be downloaded from this CSV file
Proteome-pI is available under Creative Commons Attribution-NoDerivs license, for more details see here
| Reference: Kozlowski LP. Proteome-pI 2.0: Proteome Isoelectric Point Database Update. Nucleic Acids Res. 2021, doi: 10.1093/nar/gkab944 | Contact: Lukasz P. Kozlowski |
