Mycobacterium virus Dorothy
Taxonomy: Viruses; Duplodnaviria; Heunggongvirae; Uroviricota; Caudoviricetes; Caudovirales; Siphoviridae; Cheoctovirus
Average proteome isoelectric point is 6.09
Get precalculated fractions of proteins

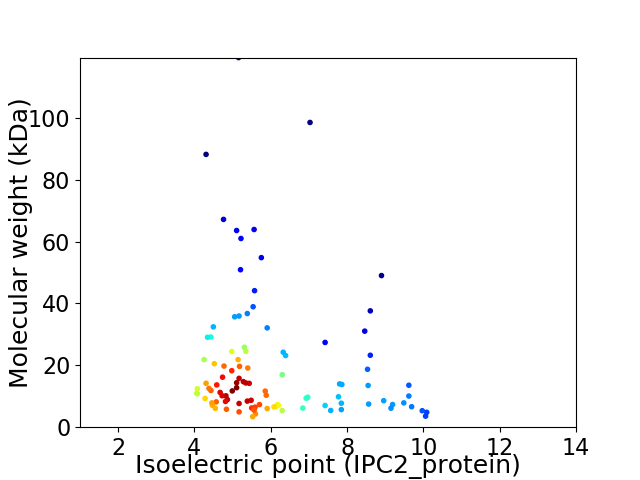
Virtual 2D-PAGE plot for 104 proteins (isoelectric point calculated using IPC2_protein)
Get csv file with sequences according to given criteria:
* You can choose from 21 different methods for calculating isoelectric point
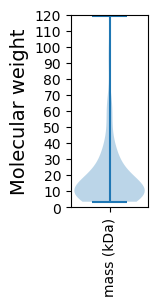
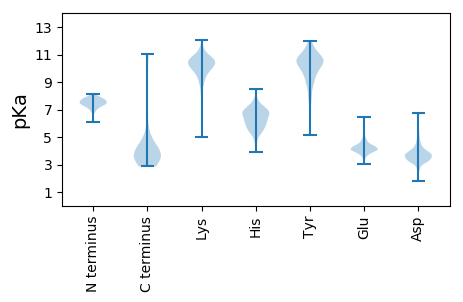
Summary statistics related to proteome-wise predictions


Protein with the lowest isoelectric point:
>tr|J7KDR3|J7KDR3_9CAUD DNA methylase OS=Mycobacterium virus Dorothy OX=1225861 GN=75 PE=3 SV=1
MM1 pKa = 7.38NATEE5 pKa = 5.72DD6 pKa = 3.71GLEE9 pKa = 4.22PLGEE13 pKa = 4.45APDD16 pKa = 4.23LGAPRR21 pKa = 11.84YY22 pKa = 9.14PMSAEE27 pKa = 4.13VTFHH31 pKa = 7.62RR32 pKa = 11.84ARR34 pKa = 11.84CTKK37 pKa = 10.5CGDD40 pKa = 3.08IEE42 pKa = 4.31TDD44 pKa = 3.37YY45 pKa = 11.76GDD47 pKa = 4.22FSAYY51 pKa = 10.11SDD53 pKa = 3.39PGGAINAVLAAADD66 pKa = 3.49WFGRR70 pKa = 11.84SAPTGEE76 pKa = 5.08LIDD79 pKa = 4.08FGGGRR84 pKa = 11.84MGQRR88 pKa = 11.84YY89 pKa = 7.81QLVEE93 pKa = 4.45LLCPDD98 pKa = 3.6CRR100 pKa = 11.84RR101 pKa = 11.84CEE103 pKa = 3.99VCGTAKK109 pKa = 10.44AYY111 pKa = 9.85PIDD114 pKa = 3.85DD115 pKa = 4.0HH116 pKa = 6.93LVCEE120 pKa = 4.29DD121 pKa = 4.12HH122 pKa = 7.29EE123 pKa = 4.31DD124 pKa = 3.94HH125 pKa = 6.79EE126 pKa = 5.25FEE128 pKa = 4.96AAPP131 pKa = 3.95
MM1 pKa = 7.38NATEE5 pKa = 5.72DD6 pKa = 3.71GLEE9 pKa = 4.22PLGEE13 pKa = 4.45APDD16 pKa = 4.23LGAPRR21 pKa = 11.84YY22 pKa = 9.14PMSAEE27 pKa = 4.13VTFHH31 pKa = 7.62RR32 pKa = 11.84ARR34 pKa = 11.84CTKK37 pKa = 10.5CGDD40 pKa = 3.08IEE42 pKa = 4.31TDD44 pKa = 3.37YY45 pKa = 11.76GDD47 pKa = 4.22FSAYY51 pKa = 10.11SDD53 pKa = 3.39PGGAINAVLAAADD66 pKa = 3.49WFGRR70 pKa = 11.84SAPTGEE76 pKa = 5.08LIDD79 pKa = 4.08FGGGRR84 pKa = 11.84MGQRR88 pKa = 11.84YY89 pKa = 7.81QLVEE93 pKa = 4.45LLCPDD98 pKa = 3.6CRR100 pKa = 11.84RR101 pKa = 11.84CEE103 pKa = 3.99VCGTAKK109 pKa = 10.44AYY111 pKa = 9.85PIDD114 pKa = 3.85DD115 pKa = 4.0HH116 pKa = 6.93LVCEE120 pKa = 4.29DD121 pKa = 4.12HH122 pKa = 7.29EE123 pKa = 4.31DD124 pKa = 3.94HH125 pKa = 6.79EE126 pKa = 5.25FEE128 pKa = 4.96AAPP131 pKa = 3.95
Molecular weight: 14.19 kDa
Isoelectric point according different methods:
Protein with the highest isoelectric point:
>tr|J7KM93|J7KM93_9CAUD Minor tail protein OS=Mycobacterium virus Dorothy OX=1225861 GN=17 PE=4 SV=1
MM1 pKa = 7.17QLRR4 pKa = 11.84IIRR7 pKa = 11.84GGAMSSDD14 pKa = 4.14FWWGMFVIPAAALAVAGVLVAVMAVIWASAKK45 pKa = 9.67WGGNEE50 pKa = 3.63YY51 pKa = 10.91KK52 pKa = 10.34LWPKK56 pKa = 10.29RR57 pKa = 11.84WGQRR61 pKa = 11.84EE62 pKa = 4.31SIVTVVATAKK72 pKa = 9.94SVRR75 pKa = 11.84YY76 pKa = 8.89LWIPGWHH83 pKa = 5.78IVICRR88 pKa = 11.84TTMATQEE95 pKa = 4.67SRR97 pKa = 11.84PEE99 pKa = 3.5WQRR102 pKa = 11.84RR103 pKa = 11.84LRR105 pKa = 11.84VQHH108 pKa = 6.91AIGAAIRR115 pKa = 11.84AEE117 pKa = 4.23EE118 pKa = 4.07EE119 pKa = 3.92AA120 pKa = 4.55
MM1 pKa = 7.17QLRR4 pKa = 11.84IIRR7 pKa = 11.84GGAMSSDD14 pKa = 4.14FWWGMFVIPAAALAVAGVLVAVMAVIWASAKK45 pKa = 9.67WGGNEE50 pKa = 3.63YY51 pKa = 10.91KK52 pKa = 10.34LWPKK56 pKa = 10.29RR57 pKa = 11.84WGQRR61 pKa = 11.84EE62 pKa = 4.31SIVTVVATAKK72 pKa = 9.94SVRR75 pKa = 11.84YY76 pKa = 8.89LWIPGWHH83 pKa = 5.78IVICRR88 pKa = 11.84TTMATQEE95 pKa = 4.67SRR97 pKa = 11.84PEE99 pKa = 3.5WQRR102 pKa = 11.84RR103 pKa = 11.84LRR105 pKa = 11.84VQHH108 pKa = 6.91AIGAAIRR115 pKa = 11.84AEE117 pKa = 4.23EE118 pKa = 4.07EE119 pKa = 3.92AA120 pKa = 4.55
Molecular weight: 13.56 kDa
Isoelectric point according different methods:
Peptides (in silico digests for buttom-up proteomics)
Below you can find in silico digests of the whole proteome with Trypsin, Chymotrypsin, Trypsin+LysC, LysN, ArgC proteases suitable for different mass spec machines.| Try ESI |
 |
|---|
| ChTry ESI |
 |
|---|
| ArgC ESI |
 |
|---|
| LysN ESI |
 |
|---|
| TryLysC ESI |
 |
|---|
| Try MALDI |
 |
|---|
| ChTry MALDI |
 |
|---|
| ArgC MALDI |
 |
|---|
| LysN MALDI |
 |
|---|
| TryLysC MALDI |
 |
|---|
| Try LTQ |
 |
|---|
| ChTry LTQ |
 |
|---|
| ArgC LTQ |
 |
|---|
| LysN LTQ |
 |
|---|
| TryLysC LTQ |
 |
|---|
| Try MSlow |
 |
|---|
| ChTry MSlow |
 |
|---|
| ArgC MSlow |
 |
|---|
| LysN MSlow |
 |
|---|
| TryLysC MSlow |
 |
|---|
| Try MShigh |
 |
|---|
| ChTry MShigh |
 |
|---|
| ArgC MShigh |
 |
|---|
| LysN MShigh |
 |
|---|
| TryLysC MShigh |
 |
|---|
General Statistics
Number of major isoforms |
Number of additional isoforms |
Number of all proteins |
Number of amino acids |
Min. Seq. Length |
Max. Seq. Length |
Avg. Seq. Length |
Avg. Mol. Weight |
|---|---|---|---|---|---|---|---|
0 |
18761 |
30 |
1168 |
180.4 |
19.8 |
Amino acid frequency
Ala |
Cys |
Asp |
Glu |
Phe |
Gly |
His |
Ile |
Lys |
Leu |
|---|---|---|---|---|---|---|---|---|---|
10.33 ± 0.425 | 1.269 ± 0.157 |
6.641 ± 0.235 | 5.986 ± 0.329 |
2.969 ± 0.185 | 8.992 ± 0.613 |
2.212 ± 0.191 | 4.349 ± 0.187 |
3.438 ± 0.213 | 7.372 ± 0.221 |
Met |
Asn |
Gln |
Pro |
Arg |
Ser |
Thr |
Val |
Trp |
Tyr |
|---|---|---|---|---|---|---|---|---|---|
2.255 ± 0.13 | 3.385 ± 0.173 |
5.938 ± 0.213 | 3.545 ± 0.173 |
7.036 ± 0.411 | 5.73 ± 0.297 |
6.386 ± 0.28 | 7.137 ± 0.269 |
2.484 ± 0.177 | 2.548 ± 0.165 |
Most of the basic statistics you can see at this page can be downloaded from this CSV file
Proteome-pI is available under Creative Commons Attribution-NoDerivs license, for more details see here
| Reference: Kozlowski LP. Proteome-pI 2.0: Proteome Isoelectric Point Database Update. Nucleic Acids Res. 2021, doi: 10.1093/nar/gkab944 | Contact: Lukasz P. Kozlowski |
