Kroppenstedtia eburnea
Taxonomy: cellular organisms; Bacteria; Terrabacteria group; Firmicutes; Bacilli; Bacillales; Thermoactinomycetaceae; Kroppenstedtia
Average proteome isoelectric point is 6.74
Get precalculated fractions of proteins

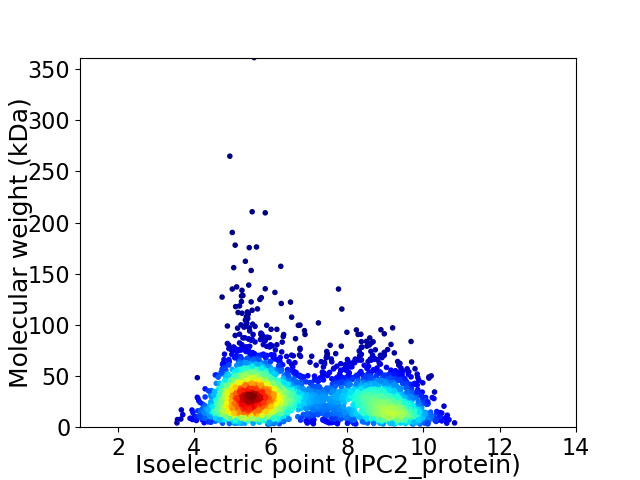
Virtual 2D-PAGE plot for 3484 proteins (isoelectric point calculated using IPC2_protein)
Get csv file with sequences according to given criteria:
* You can choose from 21 different methods for calculating isoelectric point
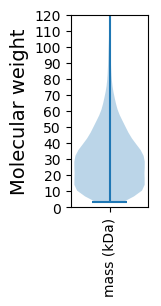
Summary statistics related to proteome-wise predictions


Protein with the lowest isoelectric point:
>tr|A0A1N7KW18|A0A1N7KW18_9BACL Competence protein ComEA OS=Kroppenstedtia eburnea OX=714067 GN=SAMN05421790_103304 PE=4 SV=1
MM1 pKa = 7.67ARR3 pKa = 11.84MLCKK7 pKa = 10.35CGEE10 pKa = 4.32TLSTVQVPNEE20 pKa = 3.75IEE22 pKa = 4.21LYY24 pKa = 10.27VYY26 pKa = 10.61TDD28 pKa = 3.6FEE30 pKa = 4.26MDD32 pKa = 4.62EE33 pKa = 4.24INAMDD38 pKa = 4.64INDD41 pKa = 4.37PMDD44 pKa = 3.75IPDD47 pKa = 4.12PEE49 pKa = 4.61RR50 pKa = 11.84DD51 pKa = 3.24VWRR54 pKa = 11.84CPHH57 pKa = 6.64CEE59 pKa = 3.71RR60 pKa = 11.84IYY62 pKa = 11.31VFDD65 pKa = 4.06GNKK68 pKa = 9.86VIKK71 pKa = 9.67TYY73 pKa = 10.65VLEE76 pKa = 4.25EE77 pKa = 4.42DD78 pKa = 3.92EE79 pKa = 4.7EE80 pKa = 4.6EE81 pKa = 4.35EE82 pKa = 4.75NGGNN86 pKa = 3.74
MM1 pKa = 7.67ARR3 pKa = 11.84MLCKK7 pKa = 10.35CGEE10 pKa = 4.32TLSTVQVPNEE20 pKa = 3.75IEE22 pKa = 4.21LYY24 pKa = 10.27VYY26 pKa = 10.61TDD28 pKa = 3.6FEE30 pKa = 4.26MDD32 pKa = 4.62EE33 pKa = 4.24INAMDD38 pKa = 4.64INDD41 pKa = 4.37PMDD44 pKa = 3.75IPDD47 pKa = 4.12PEE49 pKa = 4.61RR50 pKa = 11.84DD51 pKa = 3.24VWRR54 pKa = 11.84CPHH57 pKa = 6.64CEE59 pKa = 3.71RR60 pKa = 11.84IYY62 pKa = 11.31VFDD65 pKa = 4.06GNKK68 pKa = 9.86VIKK71 pKa = 9.67TYY73 pKa = 10.65VLEE76 pKa = 4.25EE77 pKa = 4.42DD78 pKa = 3.92EE79 pKa = 4.7EE80 pKa = 4.6EE81 pKa = 4.35EE82 pKa = 4.75NGGNN86 pKa = 3.74
Molecular weight: 10.07 kDa
Isoelectric point according different methods:
Protein with the highest isoelectric point:
>tr|A0A1N7LXB9|A0A1N7LXB9_9BACL 2-isopropylmalate synthase OS=Kroppenstedtia eburnea OX=714067 GN=leuA PE=3 SV=1
MM1 pKa = 7.07QGWNRR6 pKa = 11.84ASRR9 pKa = 11.84FAQQSFALWVLVFAGIAWMFPEE31 pKa = 4.6IFQWIGPAITPLLGIIMFGMGLTLKK56 pKa = 10.68GADD59 pKa = 3.44FRR61 pKa = 11.84LVFQRR66 pKa = 11.84PGPVLAGVCLQFIIMPATAWIVATALGLPPEE97 pKa = 4.49LAAGVMLVGACPGGTASNVIVYY119 pKa = 9.41LSKK122 pKa = 11.25GDD124 pKa = 3.69VPLSVTMTSISTLLAPLLTPFLLWWLAGSWLPVDD158 pKa = 4.39PGSMVLSILQVVILPIVLGLLVRR181 pKa = 11.84RR182 pKa = 11.84FFPVTVRR189 pKa = 11.84RR190 pKa = 11.84ATEE193 pKa = 4.0ALPLISVTAIVIIVAGVVALNADD216 pKa = 4.09SLGKK220 pKa = 8.21TALPVILAVILHH232 pKa = 6.42NGLGLLLGYY241 pKa = 9.19WCARR245 pKa = 11.84ALRR248 pKa = 11.84LDD250 pKa = 3.82EE251 pKa = 4.48PRR253 pKa = 11.84SRR255 pKa = 11.84AVSIEE260 pKa = 3.55VGMQNSGLAVALALAHH276 pKa = 6.62LNPIAALPGAIFSVWHH292 pKa = 6.48NISGSLLATYY302 pKa = 9.27WSRR305 pKa = 11.84KK306 pKa = 8.16GRR308 pKa = 11.84AKK310 pKa = 9.75TRR312 pKa = 11.84PTQAATGG319 pKa = 3.71
MM1 pKa = 7.07QGWNRR6 pKa = 11.84ASRR9 pKa = 11.84FAQQSFALWVLVFAGIAWMFPEE31 pKa = 4.6IFQWIGPAITPLLGIIMFGMGLTLKK56 pKa = 10.68GADD59 pKa = 3.44FRR61 pKa = 11.84LVFQRR66 pKa = 11.84PGPVLAGVCLQFIIMPATAWIVATALGLPPEE97 pKa = 4.49LAAGVMLVGACPGGTASNVIVYY119 pKa = 9.41LSKK122 pKa = 11.25GDD124 pKa = 3.69VPLSVTMTSISTLLAPLLTPFLLWWLAGSWLPVDD158 pKa = 4.39PGSMVLSILQVVILPIVLGLLVRR181 pKa = 11.84RR182 pKa = 11.84FFPVTVRR189 pKa = 11.84RR190 pKa = 11.84ATEE193 pKa = 4.0ALPLISVTAIVIIVAGVVALNADD216 pKa = 4.09SLGKK220 pKa = 8.21TALPVILAVILHH232 pKa = 6.42NGLGLLLGYY241 pKa = 9.19WCARR245 pKa = 11.84ALRR248 pKa = 11.84LDD250 pKa = 3.82EE251 pKa = 4.48PRR253 pKa = 11.84SRR255 pKa = 11.84AVSIEE260 pKa = 3.55VGMQNSGLAVALALAHH276 pKa = 6.62LNPIAALPGAIFSVWHH292 pKa = 6.48NISGSLLATYY302 pKa = 9.27WSRR305 pKa = 11.84KK306 pKa = 8.16GRR308 pKa = 11.84AKK310 pKa = 9.75TRR312 pKa = 11.84PTQAATGG319 pKa = 3.71
Molecular weight: 33.87 kDa
Isoelectric point according different methods:
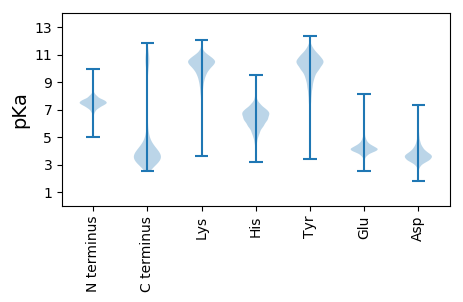
Peptides (in silico digests for buttom-up proteomics)
Below you can find in silico digests of the whole proteome with Trypsin, Chymotrypsin, Trypsin+LysC, LysN, ArgC proteases suitable for different mass spec machines.| Try ESI |
 |
|---|
| ChTry ESI |
 |
|---|
| ArgC ESI |
 |
|---|
| LysN ESI |
 |
|---|
| TryLysC ESI |
 |
|---|
| Try MALDI |
 |
|---|
| ChTry MALDI |
 |
|---|
| ArgC MALDI |
 |
|---|
| LysN MALDI |
 |
|---|
| TryLysC MALDI |
 |
|---|
| Try LTQ |
 |
|---|
| ChTry LTQ |
 |
|---|
| ArgC LTQ |
 |
|---|
| LysN LTQ |
 |
|---|
| TryLysC LTQ |
 |
|---|
| Try MSlow |
 |
|---|
| ChTry MSlow |
 |
|---|
| ArgC MSlow |
 |
|---|
| LysN MSlow |
 |
|---|
| TryLysC MSlow |
 |
|---|
| Try MShigh |
 |
|---|
| ChTry MShigh |
 |
|---|
| ArgC MShigh |
 |
|---|
| LysN MShigh |
 |
|---|
| TryLysC MShigh |
 |
|---|
General Statistics
Number of major isoforms |
Number of additional isoforms |
Number of all proteins |
Number of amino acids |
Min. Seq. Length |
Max. Seq. Length |
Avg. Seq. Length |
Avg. Mol. Weight |
|---|---|---|---|---|---|---|---|
0 |
997009 |
27 |
3165 |
286.2 |
31.99 |
Amino acid frequency
Ala |
Cys |
Asp |
Glu |
Phe |
Gly |
His |
Ile |
Lys |
Leu |
|---|---|---|---|---|---|---|---|---|---|
7.744 ± 0.041 | 0.77 ± 0.012 |
5.015 ± 0.031 | 7.558 ± 0.058 |
3.858 ± 0.031 | 8.238 ± 0.041 |
2.319 ± 0.019 | 5.848 ± 0.04 |
5.138 ± 0.043 | 10.404 ± 0.058 |
Met |
Asn |
Gln |
Pro |
Arg |
Ser |
Thr |
Val |
Trp |
Tyr |
|---|---|---|---|---|---|---|---|---|---|
2.7 ± 0.019 | 2.902 ± 0.03 |
4.671 ± 0.034 | 3.715 ± 0.029 |
6.752 ± 0.047 | 5.426 ± 0.026 |
5.134 ± 0.032 | 7.564 ± 0.037 |
1.409 ± 0.02 | 2.833 ± 0.023 |
Most of the basic statistics you can see at this page can be downloaded from this CSV file
Proteome-pI is available under Creative Commons Attribution-NoDerivs license, for more details see here
| Reference: Kozlowski LP. Proteome-pI 2.0: Proteome Isoelectric Point Database Update. Nucleic Acids Res. 2021, doi: 10.1093/nar/gkab944 | Contact: Lukasz P. Kozlowski |
