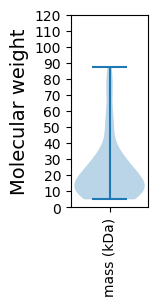
Microbacterium phage Shee
Taxonomy: Viruses; Duplodnaviria; Heunggongvirae; Uroviricota; Caudoviricetes; Caudovirales; Siphoviridae; Ilzatvirus; unclassified Ilzatvirus
Average proteome isoelectric point is 6.06
Get precalculated fractions of proteins

Virtual 2D-PAGE plot for 63 proteins (isoelectric point calculated using IPC2_protein)
Get csv file with sequences according to given criteria:
* You can choose from 21 different methods for calculating isoelectric point
Summary statistics related to proteome-wise predictions


Protein with the lowest isoelectric point:
>tr|A0A514A3F5|A0A514A3F5_9CAUD Uncharacterized protein OS=Microbacterium phage Shee OX=2591072 GN=61 PE=4 SV=1
MM1 pKa = 7.81ACTDD5 pKa = 4.43CDD7 pKa = 4.55DD8 pKa = 4.15KK9 pKa = 11.46QQEE12 pKa = 4.4PFSEE16 pKa = 4.6TEE18 pKa = 3.94GEE20 pKa = 4.5GTVDD24 pKa = 3.4TQEE27 pKa = 4.49TPSEE31 pKa = 4.49VYY33 pKa = 10.59DD34 pKa = 3.71HH35 pKa = 7.36AEE37 pKa = 3.76HH38 pKa = 6.96FGPPEE43 pKa = 3.55AA44 pKa = 5.69
MM1 pKa = 7.81ACTDD5 pKa = 4.43CDD7 pKa = 4.55DD8 pKa = 4.15KK9 pKa = 11.46QQEE12 pKa = 4.4PFSEE16 pKa = 4.6TEE18 pKa = 3.94GEE20 pKa = 4.5GTVDD24 pKa = 3.4TQEE27 pKa = 4.49TPSEE31 pKa = 4.49VYY33 pKa = 10.59DD34 pKa = 3.71HH35 pKa = 7.36AEE37 pKa = 3.76HH38 pKa = 6.96FGPPEE43 pKa = 3.55AA44 pKa = 5.69
Molecular weight: 4.86 kDa
Isoelectric point according different methods:
Protein with the highest isoelectric point:
>tr|A0A514A3K8|A0A514A3K8_9CAUD Uncharacterized protein OS=Microbacterium phage Shee OX=2591072 GN=63 PE=4 SV=1
MM1 pKa = 7.21PRR3 pKa = 11.84SMRR6 pKa = 11.84LTSLEE11 pKa = 3.86TRR13 pKa = 11.84IVGVPSAGRR22 pKa = 11.84SGVVPGLEE30 pKa = 4.31LGNGSGVSVGLAPEE44 pKa = 3.94PDD46 pKa = 3.48FRR48 pKa = 11.84QGCSQGHH55 pKa = 5.62SALVPQLKK63 pKa = 8.94EE64 pKa = 3.88NKK66 pKa = 9.26MSGQVLEE73 pKa = 4.9APVSARR79 pKa = 11.84FHH81 pKa = 7.35ASGQQDD87 pKa = 3.08RR88 pKa = 11.84RR89 pKa = 11.84TARR92 pKa = 11.84QDD94 pKa = 3.13GVVCVNRR101 pKa = 11.84LRR103 pKa = 11.84VRR105 pKa = 11.84ATVQNIDD112 pKa = 3.79GQWAEE117 pKa = 4.03VKK119 pKa = 10.69LSVKK123 pKa = 10.38VGEE126 pKa = 4.26GWFPLEE132 pKa = 4.2GGKK135 pKa = 10.12LRR137 pKa = 11.84VARR140 pKa = 11.84RR141 pKa = 11.84RR142 pKa = 11.84SGQRR146 pKa = 11.84EE147 pKa = 3.92AQEE150 pKa = 4.56LYY152 pKa = 10.49VVSALRR158 pKa = 11.84RR159 pKa = 11.84SLSAHH164 pKa = 5.34GVAVLSLDD172 pKa = 3.34GSEE175 pKa = 3.88QRR177 pKa = 11.84VGDD180 pKa = 3.59GVTDD184 pKa = 3.43YY185 pKa = 10.92RR186 pKa = 11.84YY187 pKa = 7.37WASMGSRR194 pKa = 11.84LTYY197 pKa = 10.53ALEE200 pKa = 3.91VSEE203 pKa = 4.91AGVVSVVNLPP213 pKa = 3.41
MM1 pKa = 7.21PRR3 pKa = 11.84SMRR6 pKa = 11.84LTSLEE11 pKa = 3.86TRR13 pKa = 11.84IVGVPSAGRR22 pKa = 11.84SGVVPGLEE30 pKa = 4.31LGNGSGVSVGLAPEE44 pKa = 3.94PDD46 pKa = 3.48FRR48 pKa = 11.84QGCSQGHH55 pKa = 5.62SALVPQLKK63 pKa = 8.94EE64 pKa = 3.88NKK66 pKa = 9.26MSGQVLEE73 pKa = 4.9APVSARR79 pKa = 11.84FHH81 pKa = 7.35ASGQQDD87 pKa = 3.08RR88 pKa = 11.84RR89 pKa = 11.84TARR92 pKa = 11.84QDD94 pKa = 3.13GVVCVNRR101 pKa = 11.84LRR103 pKa = 11.84VRR105 pKa = 11.84ATVQNIDD112 pKa = 3.79GQWAEE117 pKa = 4.03VKK119 pKa = 10.69LSVKK123 pKa = 10.38VGEE126 pKa = 4.26GWFPLEE132 pKa = 4.2GGKK135 pKa = 10.12LRR137 pKa = 11.84VARR140 pKa = 11.84RR141 pKa = 11.84RR142 pKa = 11.84SGQRR146 pKa = 11.84EE147 pKa = 3.92AQEE150 pKa = 4.56LYY152 pKa = 10.49VVSALRR158 pKa = 11.84RR159 pKa = 11.84SLSAHH164 pKa = 5.34GVAVLSLDD172 pKa = 3.34GSEE175 pKa = 3.88QRR177 pKa = 11.84VGDD180 pKa = 3.59GVTDD184 pKa = 3.43YY185 pKa = 10.92RR186 pKa = 11.84YY187 pKa = 7.37WASMGSRR194 pKa = 11.84LTYY197 pKa = 10.53ALEE200 pKa = 3.91VSEE203 pKa = 4.91AGVVSVVNLPP213 pKa = 3.41
Molecular weight: 22.88 kDa
Isoelectric point according different methods:
Peptides (in silico digests for buttom-up proteomics)
Below you can find in silico digests of the whole proteome with Trypsin, Chymotrypsin, Trypsin+LysC, LysN, ArgC proteases suitable for different mass spec machines.| Try ESI |
 |
|---|
| ChTry ESI |
 |
|---|
| ArgC ESI |
 |
|---|
| LysN ESI |
 |
|---|
| TryLysC ESI |
 |
|---|
| Try MALDI |
 |
|---|
| ChTry MALDI |
 |
|---|
| ArgC MALDI |
 |
|---|
| LysN MALDI |
 |
|---|
| TryLysC MALDI |
 |
|---|
| Try LTQ |
 |
|---|
| ChTry LTQ |
 |
|---|
| ArgC LTQ |
 |
|---|
| LysN LTQ |
 |
|---|
| TryLysC LTQ |
 |
|---|
| Try MSlow |
 |
|---|
| ChTry MSlow |
 |
|---|
| ArgC MSlow |
 |
|---|
| LysN MSlow |
 |
|---|
| TryLysC MSlow |
 |
|---|
| Try MShigh |
 |
|---|
| ChTry MShigh |
 |
|---|
| ArgC MShigh |
 |
|---|
| LysN MShigh |
 |
|---|
| TryLysC MShigh |
 |
|---|
General Statistics
Number of major isoforms |
Number of additional isoforms |
Number of all proteins |
Number of amino acids |
Min. Seq. Length |
Max. Seq. Length |
Avg. Seq. Length |
Avg. Mol. Weight |
|---|---|---|---|---|---|---|---|
0 |
13207 |
44 |
808 |
209.6 |
23.15 |
Amino acid frequency
Ala |
Cys |
Asp |
Glu |
Phe |
Gly |
His |
Ile |
Lys |
Leu |
|---|---|---|---|---|---|---|---|---|---|
9.752 ± 0.459 | 0.651 ± 0.095 |
6.353 ± 0.255 | 6.58 ± 0.401 |
3.089 ± 0.19 | 7.935 ± 0.332 |
1.878 ± 0.191 | 5.05 ± 0.369 |
4.74 ± 0.325 | 8.526 ± 0.281 |
Met |
Asn |
Gln |
Pro |
Arg |
Ser |
Thr |
Val |
Trp |
Tyr |
|---|---|---|---|---|---|---|---|---|---|
2.506 ± 0.154 | 3.135 ± 0.153 |
4.922 ± 0.258 | 3.99 ± 0.179 |
5.709 ± 0.358 | 6.088 ± 0.263 |
6.398 ± 0.284 | 7.481 ± 0.274 |
2.135 ± 0.249 | 3.082 ± 0.253 |
Most of the basic statistics you can see at this page can be downloaded from this CSV file
Proteome-pI is available under Creative Commons Attribution-NoDerivs license, for more details see here
| Reference: Kozlowski LP. Proteome-pI 2.0: Proteome Isoelectric Point Database Update. Nucleic Acids Res. 2021, doi: 10.1093/nar/gkab944 | Contact: Lukasz P. Kozlowski |
