Cellulomonas soli
Taxonomy: cellular organisms; Bacteria; Terrabacteria group; Actinobacteria; Actinomycetia; Micrococcales; Cellulomonadaceae; Cellulomonas
Average proteome isoelectric point is 6.02
Get precalculated fractions of proteins
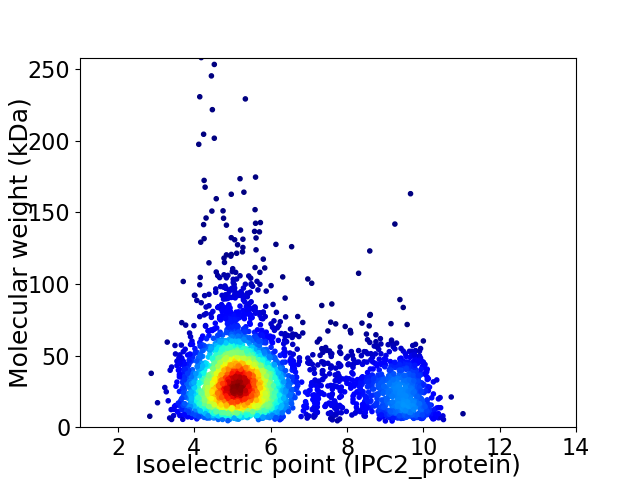
Virtual 2D-PAGE plot for 3847 proteins (isoelectric point calculated using IPC2_protein)
Get csv file with sequences according to given criteria:
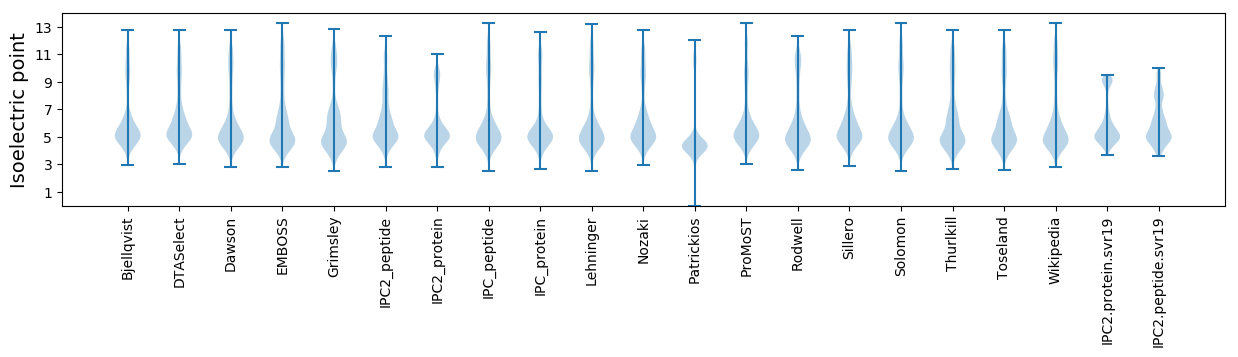
* You can choose from 21 different methods for calculating isoelectric point
Summary statistics related to proteome-wise predictions
Protein with the lowest isoelectric point:
>tr|A0A512PAN6|A0A512PAN6_9CELL Uncharacterized protein OS=Cellulomonas soli OX=931535 GN=CSO01_09940 PE=4 SV=1
MM1 pKa = 7.52CLAGATAWALDD12 pKa = 3.57RR13 pKa = 11.84FVIEE17 pKa = 4.27HH18 pKa = 5.82VEE20 pKa = 3.95IADD23 pKa = 3.51VSAYY27 pKa = 9.29EE28 pKa = 4.0AAQTGTVTTSTTTSASDD45 pKa = 3.63ALVTDD50 pKa = 4.12TTYY53 pKa = 11.27EE54 pKa = 3.99SDD56 pKa = 3.84DD57 pKa = 3.73ASITISTVTTGSGEE71 pKa = 4.1ATVTYY76 pKa = 9.96YY77 pKa = 11.02VADD80 pKa = 3.68VTLTDD85 pKa = 3.51ATVLRR90 pKa = 11.84SAFAQDD96 pKa = 3.45AFGEE100 pKa = 4.45NITEE104 pKa = 4.12NTSDD108 pKa = 3.16IAADD112 pKa = 3.53NDD114 pKa = 3.76AVFAINGDD122 pKa = 3.87YY123 pKa = 11.14YY124 pKa = 11.14GFRR127 pKa = 11.84STGIVIRR134 pKa = 11.84NGVVYY139 pKa = 9.99RR140 pKa = 11.84DD141 pKa = 3.19EE142 pKa = 4.38GARR145 pKa = 11.84EE146 pKa = 3.7GLAFYY151 pKa = 10.56RR152 pKa = 11.84DD153 pKa = 3.68GHH155 pKa = 6.34VEE157 pKa = 4.21VYY159 pKa = 11.0DD160 pKa = 3.79EE161 pKa = 4.39TTTTAEE167 pKa = 4.03EE168 pKa = 3.92LLAAGVWNTLSFGPALLEE186 pKa = 4.74DD187 pKa = 4.16GQVVDD192 pKa = 5.36GIEE195 pKa = 4.05DD196 pKa = 3.81VEE198 pKa = 4.28VDD200 pKa = 3.87TNVGNHH206 pKa = 6.74SIQGDD211 pKa = 3.79QPRR214 pKa = 11.84TAIGVIDD221 pKa = 4.7DD222 pKa = 3.62NHH224 pKa = 6.99LVFVVVDD231 pKa = 4.2GRR233 pKa = 11.84STGYY237 pKa = 10.15SAGVDD242 pKa = 3.54MTEE245 pKa = 4.72LAQIMADD252 pKa = 3.94LGATTAYY259 pKa = 10.52NIDD262 pKa = 3.82GGGSSTMVFDD272 pKa = 5.14GEE274 pKa = 4.86LVNNPLGKK282 pKa = 8.98GTEE285 pKa = 4.16RR286 pKa = 11.84GTSDD290 pKa = 2.78ILYY293 pKa = 10.14IAGG296 pKa = 3.68
MM1 pKa = 7.52CLAGATAWALDD12 pKa = 3.57RR13 pKa = 11.84FVIEE17 pKa = 4.27HH18 pKa = 5.82VEE20 pKa = 3.95IADD23 pKa = 3.51VSAYY27 pKa = 9.29EE28 pKa = 4.0AAQTGTVTTSTTTSASDD45 pKa = 3.63ALVTDD50 pKa = 4.12TTYY53 pKa = 11.27EE54 pKa = 3.99SDD56 pKa = 3.84DD57 pKa = 3.73ASITISTVTTGSGEE71 pKa = 4.1ATVTYY76 pKa = 9.96YY77 pKa = 11.02VADD80 pKa = 3.68VTLTDD85 pKa = 3.51ATVLRR90 pKa = 11.84SAFAQDD96 pKa = 3.45AFGEE100 pKa = 4.45NITEE104 pKa = 4.12NTSDD108 pKa = 3.16IAADD112 pKa = 3.53NDD114 pKa = 3.76AVFAINGDD122 pKa = 3.87YY123 pKa = 11.14YY124 pKa = 11.14GFRR127 pKa = 11.84STGIVIRR134 pKa = 11.84NGVVYY139 pKa = 9.99RR140 pKa = 11.84DD141 pKa = 3.19EE142 pKa = 4.38GARR145 pKa = 11.84EE146 pKa = 3.7GLAFYY151 pKa = 10.56RR152 pKa = 11.84DD153 pKa = 3.68GHH155 pKa = 6.34VEE157 pKa = 4.21VYY159 pKa = 11.0DD160 pKa = 3.79EE161 pKa = 4.39TTTTAEE167 pKa = 4.03EE168 pKa = 3.92LLAAGVWNTLSFGPALLEE186 pKa = 4.74DD187 pKa = 4.16GQVVDD192 pKa = 5.36GIEE195 pKa = 4.05DD196 pKa = 3.81VEE198 pKa = 4.28VDD200 pKa = 3.87TNVGNHH206 pKa = 6.74SIQGDD211 pKa = 3.79QPRR214 pKa = 11.84TAIGVIDD221 pKa = 4.7DD222 pKa = 3.62NHH224 pKa = 6.99LVFVVVDD231 pKa = 4.2GRR233 pKa = 11.84STGYY237 pKa = 10.15SAGVDD242 pKa = 3.54MTEE245 pKa = 4.72LAQIMADD252 pKa = 3.94LGATTAYY259 pKa = 10.52NIDD262 pKa = 3.82GGGSSTMVFDD272 pKa = 5.14GEE274 pKa = 4.86LVNNPLGKK282 pKa = 8.98GTEE285 pKa = 4.16RR286 pKa = 11.84GTSDD290 pKa = 2.78ILYY293 pKa = 10.14IAGG296 pKa = 3.68
Molecular weight: 31.07 kDa
Isoelectric point according different methods:
Protein with the highest isoelectric point:
>tr|A0A512PD09|A0A512PD09_9CELL Uncharacterized protein OS=Cellulomonas soli OX=931535 GN=CSO01_18050 PE=4 SV=1
MM1 pKa = 6.74VTPSHH6 pKa = 6.75LRR8 pKa = 11.84RR9 pKa = 11.84TVAPAVVLGTRR20 pKa = 11.84PPRR23 pKa = 11.84VARR26 pKa = 11.84RR27 pKa = 11.84ARR29 pKa = 11.84GGRR32 pKa = 11.84ALARR36 pKa = 11.84VVVLAAVVGVLVAVLLVAPASSGAGEE62 pKa = 4.28LLVGAVAFGSTLLGAGAVVLVRR84 pKa = 11.84RR85 pKa = 11.84LRR87 pKa = 11.84RR88 pKa = 11.84SRR90 pKa = 11.84TRR92 pKa = 3.06
MM1 pKa = 6.74VTPSHH6 pKa = 6.75LRR8 pKa = 11.84RR9 pKa = 11.84TVAPAVVLGTRR20 pKa = 11.84PPRR23 pKa = 11.84VARR26 pKa = 11.84RR27 pKa = 11.84ARR29 pKa = 11.84GGRR32 pKa = 11.84ALARR36 pKa = 11.84VVVLAAVVGVLVAVLLVAPASSGAGEE62 pKa = 4.28LLVGAVAFGSTLLGAGAVVLVRR84 pKa = 11.84RR85 pKa = 11.84LRR87 pKa = 11.84RR88 pKa = 11.84SRR90 pKa = 11.84TRR92 pKa = 3.06
Molecular weight: 9.39 kDa
Isoelectric point according different methods:
Peptides (in silico digests for buttom-up proteomics)
Below you can find in silico digests of the whole proteome with Trypsin, Chymotrypsin, Trypsin+LysC, LysN, ArgC proteases suitable for different mass spec machines.| Try ESI |
 |
|---|
| ChTry ESI |
|
|---|
| ArgC ESI |
|
|---|
| LysN ESI |
|
|---|
| TryLysC ESI |
|
|---|
| Try MALDI |
|
|---|
| ChTry MALDI |
|
|---|
| ArgC MALDI |
|
|---|
| LysN MALDI |
|
|---|
| TryLysC MALDI |
|
|---|
| Try LTQ |
|
|---|
| ChTry LTQ |
|
|---|
| ArgC LTQ |
|
|---|
| LysN LTQ |
|
|---|
| TryLysC LTQ |
|
|---|
| Try MSlow |
|
|---|
| ChTry MSlow |
|
|---|
| ArgC MSlow |
|
|---|
| LysN MSlow |
|
|---|
| TryLysC MSlow |
|
|---|
| Try MShigh |
|
|---|
| ChTry MShigh |
|
|---|
| ArgC MShigh |
|
|---|
| LysN MShigh |
|
|---|
| TryLysC MShigh |
|
|---|
General Statistics
Number of major isoforms |
Number of additional isoforms |
Number of all proteins |
Number of amino acids |
Min. Seq. Length |
Max. Seq. Length |
Avg. Seq. Length |
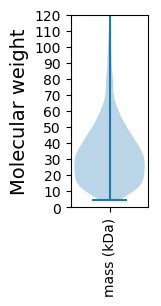
Avg. Mol. Weight |
|---|---|---|---|---|---|---|---|
0 |
1283081 |
39 |
2578 |
333.5 |
35.27 |
Amino acid frequency
Ala |
Cys |
Asp |
Glu |
Phe |
Gly |
His |
Ile |
Lys |
Leu |
|---|---|---|---|---|---|---|---|---|---|
14.434 ± 0.053 | 0.568 ± 0.009 |
6.402 ± 0.033 | 5.09 ± 0.037 |
2.46 ± 0.022 | 9.379 ± 0.037 |
2.123 ± 0.023 | 2.875 ± 0.028 |
1.292 ± 0.023 | 10.495 ± 0.048 |
Met |
Asn |
Gln |
Pro |
Arg |
Ser |
Thr |
Val |
Trp |
Tyr |
|---|---|---|---|---|---|---|---|---|---|
1.533 ± 0.013 | 1.383 ± 0.018 |
5.932 ± 0.035 | 2.847 ± 0.019 |
7.642 ± 0.044 | 5.173 ± 0.036 |
6.751 ± 0.05 | 10.294 ± 0.043 |
1.536 ± 0.019 | 1.791 ± 0.019 |
Most of the basic statistics you can see at this page can be downloaded from this CSV file
See this proteome in:

Proteome-pI is available under Creative Commons Attribution-NoDerivs license, for more details see here
| Reference: Kozlowski LP. Proteome-pI 2.0: Proteome Isoelectric Point Database Update. Nucleic Acids Res. 2021, doi: 10.1093/nar/gkab944 | Contact: Lukasz P. Kozlowski |