Banana bunchy top virus (BBTV)
Taxonomy: Viruses; Monodnaviria; Shotokuvirae; Cressdnaviricota; Arfiviricetes; Mulpavirales; Nanoviridae; Babuvirus
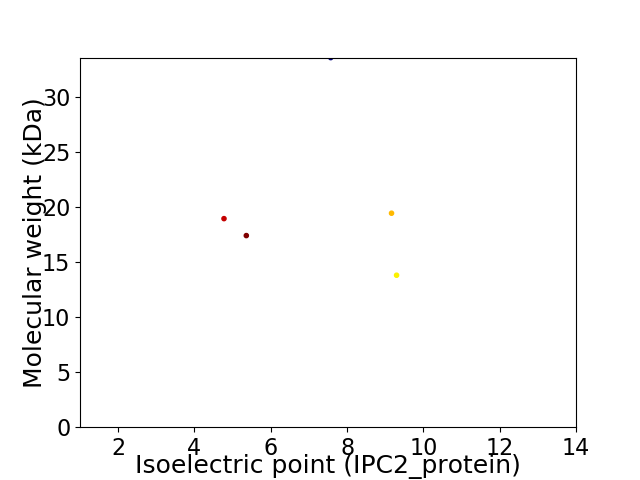
Average proteome isoelectric point is 7.05
Get precalculated fractions of proteins

Virtual 2D-PAGE plot for 5 proteins (isoelectric point calculated using IPC2_protein)
Get csv file with sequences according to given criteria:
* You can choose from 21 different methods for calculating isoelectric point
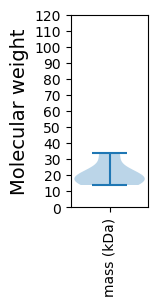
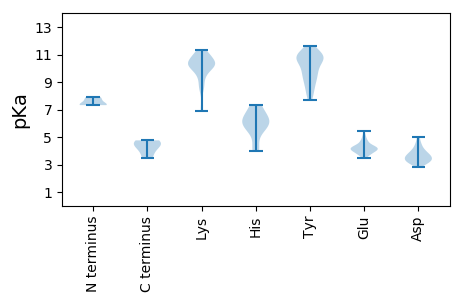
Summary statistics related to proteome-wise predictions


Protein with the lowest isoelectric point:
>tr|Q4A1I8|Q4A1I8_BBTV Master replication initiator protein OS=Banana bunchy top virus OX=12585 GN=rep PE=3 SV=1
MM1 pKa = 7.33EE2 pKa = 4.97FWEE5 pKa = 4.67SSAMPDD11 pKa = 3.64DD12 pKa = 3.95VKK14 pKa = 11.31RR15 pKa = 11.84EE16 pKa = 3.72IKK18 pKa = 10.1EE19 pKa = 4.02IYY21 pKa = 9.15WEE23 pKa = 4.07DD24 pKa = 3.32RR25 pKa = 11.84KK26 pKa = 11.05KK27 pKa = 11.13LLFCQKK33 pKa = 9.66LKK35 pKa = 10.9SYY37 pKa = 9.52VRR39 pKa = 11.84RR40 pKa = 11.84ILVYY44 pKa = 10.64GDD46 pKa = 3.7QEE48 pKa = 4.09DD49 pKa = 3.97ALAGVKK55 pKa = 9.73DD56 pKa = 4.52LKK58 pKa = 10.44TSIIRR63 pKa = 11.84YY64 pKa = 8.98SEE66 pKa = 4.17YY67 pKa = 10.68LKK69 pKa = 10.7KK70 pKa = 10.21PCVVICCVSNKK81 pKa = 10.3SIVYY85 pKa = 9.52RR86 pKa = 11.84LNSMVFFYY94 pKa = 10.84HH95 pKa = 7.31EE96 pKa = 4.24YY97 pKa = 10.77LEE99 pKa = 4.32EE100 pKa = 5.46LGGDD104 pKa = 3.39YY105 pKa = 10.77SVYY108 pKa = 10.45QDD110 pKa = 4.41LYY112 pKa = 9.79CDD114 pKa = 3.93EE115 pKa = 4.72VLSSSSTEE123 pKa = 3.93EE124 pKa = 3.64EE125 pKa = 4.28DD126 pKa = 3.54VGVIYY131 pKa = 10.6RR132 pKa = 11.84NVIMASTQEE141 pKa = 3.96KK142 pKa = 10.32FSWSDD147 pKa = 3.2CQKK150 pKa = 10.72IVISDD155 pKa = 3.75YY156 pKa = 11.63DD157 pKa = 3.64VTLLL161 pKa = 4.53
MM1 pKa = 7.33EE2 pKa = 4.97FWEE5 pKa = 4.67SSAMPDD11 pKa = 3.64DD12 pKa = 3.95VKK14 pKa = 11.31RR15 pKa = 11.84EE16 pKa = 3.72IKK18 pKa = 10.1EE19 pKa = 4.02IYY21 pKa = 9.15WEE23 pKa = 4.07DD24 pKa = 3.32RR25 pKa = 11.84KK26 pKa = 11.05KK27 pKa = 11.13LLFCQKK33 pKa = 9.66LKK35 pKa = 10.9SYY37 pKa = 9.52VRR39 pKa = 11.84RR40 pKa = 11.84ILVYY44 pKa = 10.64GDD46 pKa = 3.7QEE48 pKa = 4.09DD49 pKa = 3.97ALAGVKK55 pKa = 9.73DD56 pKa = 4.52LKK58 pKa = 10.44TSIIRR63 pKa = 11.84YY64 pKa = 8.98SEE66 pKa = 4.17YY67 pKa = 10.68LKK69 pKa = 10.7KK70 pKa = 10.21PCVVICCVSNKK81 pKa = 10.3SIVYY85 pKa = 9.52RR86 pKa = 11.84LNSMVFFYY94 pKa = 10.84HH95 pKa = 7.31EE96 pKa = 4.24YY97 pKa = 10.77LEE99 pKa = 4.32EE100 pKa = 5.46LGGDD104 pKa = 3.39YY105 pKa = 10.77SVYY108 pKa = 10.45QDD110 pKa = 4.41LYY112 pKa = 9.79CDD114 pKa = 3.93EE115 pKa = 4.72VLSSSSTEE123 pKa = 3.93EE124 pKa = 3.64EE125 pKa = 4.28DD126 pKa = 3.54VGVIYY131 pKa = 10.6RR132 pKa = 11.84NVIMASTQEE141 pKa = 3.96KK142 pKa = 10.32FSWSDD147 pKa = 3.2CQKK150 pKa = 10.72IVISDD155 pKa = 3.75YY156 pKa = 11.63DD157 pKa = 3.64VTLLL161 pKa = 4.53
Molecular weight: 18.95 kDa
Isoelectric point according different methods:
Protein with the highest isoelectric point:
>tr|Q9PWT9|Q9PWT9_BBTV Capsid protein OS=Banana bunchy top virus OX=12585 GN=cp PE=3 SV=1
MM1 pKa = 7.37ARR3 pKa = 11.84YY4 pKa = 7.71PKK6 pKa = 10.43KK7 pKa = 10.22SIKK10 pKa = 9.36KK11 pKa = 8.63RR12 pKa = 11.84RR13 pKa = 11.84VGRR16 pKa = 11.84RR17 pKa = 11.84KK18 pKa = 10.11YY19 pKa = 10.24GSKK22 pKa = 10.38AATSHH27 pKa = 7.34DD28 pKa = 4.11YY29 pKa = 11.37SSLGSILVPEE39 pKa = 4.2NTVKK43 pKa = 10.29VFRR46 pKa = 11.84IEE48 pKa = 4.17PTDD51 pKa = 3.37KK52 pKa = 10.24TLPRR56 pKa = 11.84YY57 pKa = 8.25FIWKK61 pKa = 8.52MFMLLVCKK69 pKa = 10.15VKK71 pKa = 10.32PGRR74 pKa = 11.84ILHH77 pKa = 5.87WAMIKK82 pKa = 10.45SSWEE86 pKa = 3.49INQPTTCLEE95 pKa = 4.07APGLFIKK102 pKa = 10.26PEE104 pKa = 3.95HH105 pKa = 5.73SHH107 pKa = 6.35LVKK110 pKa = 10.53LVCSGEE116 pKa = 4.15LEE118 pKa = 4.25AGVATGTSDD127 pKa = 4.34VEE129 pKa = 3.99CLLRR133 pKa = 11.84KK134 pKa = 6.9TTVLRR139 pKa = 11.84KK140 pKa = 9.69NVTEE144 pKa = 3.73VDD146 pKa = 3.52YY147 pKa = 11.13LYY149 pKa = 11.24LAFYY153 pKa = 9.92CSSGVSINYY162 pKa = 7.83QNRR165 pKa = 11.84ITYY168 pKa = 9.37HH169 pKa = 4.27VV170 pKa = 3.46
MM1 pKa = 7.37ARR3 pKa = 11.84YY4 pKa = 7.71PKK6 pKa = 10.43KK7 pKa = 10.22SIKK10 pKa = 9.36KK11 pKa = 8.63RR12 pKa = 11.84RR13 pKa = 11.84VGRR16 pKa = 11.84RR17 pKa = 11.84KK18 pKa = 10.11YY19 pKa = 10.24GSKK22 pKa = 10.38AATSHH27 pKa = 7.34DD28 pKa = 4.11YY29 pKa = 11.37SSLGSILVPEE39 pKa = 4.2NTVKK43 pKa = 10.29VFRR46 pKa = 11.84IEE48 pKa = 4.17PTDD51 pKa = 3.37KK52 pKa = 10.24TLPRR56 pKa = 11.84YY57 pKa = 8.25FIWKK61 pKa = 8.52MFMLLVCKK69 pKa = 10.15VKK71 pKa = 10.32PGRR74 pKa = 11.84ILHH77 pKa = 5.87WAMIKK82 pKa = 10.45SSWEE86 pKa = 3.49INQPTTCLEE95 pKa = 4.07APGLFIKK102 pKa = 10.26PEE104 pKa = 3.95HH105 pKa = 5.73SHH107 pKa = 6.35LVKK110 pKa = 10.53LVCSGEE116 pKa = 4.15LEE118 pKa = 4.25AGVATGTSDD127 pKa = 4.34VEE129 pKa = 3.99CLLRR133 pKa = 11.84KK134 pKa = 6.9TTVLRR139 pKa = 11.84KK140 pKa = 9.69NVTEE144 pKa = 3.73VDD146 pKa = 3.52YY147 pKa = 11.13LYY149 pKa = 11.24LAFYY153 pKa = 9.92CSSGVSINYY162 pKa = 7.83QNRR165 pKa = 11.84ITYY168 pKa = 9.37HH169 pKa = 4.27VV170 pKa = 3.46
Molecular weight: 19.45 kDa
Isoelectric point according different methods:
Peptides (in silico digests for buttom-up proteomics)
Below you can find in silico digests of the whole proteome with Trypsin, Chymotrypsin, Trypsin+LysC, LysN, ArgC proteases suitable for different mass spec machines.| Try ESI |
 |
|---|
| ChTry ESI |
 |
|---|
| ArgC ESI |
 |
|---|
| LysN ESI |
 |
|---|
| TryLysC ESI |
 |
|---|
| Try MALDI |
 |
|---|
| ChTry MALDI |
 |
|---|
| ArgC MALDI |
 |
|---|
| LysN MALDI |
 |
|---|
| TryLysC MALDI |
 |
|---|
| Try LTQ |
 |
|---|
| ChTry LTQ |
 |
|---|
| ArgC LTQ |
 |
|---|
| LysN LTQ |
 |
|---|
| TryLysC LTQ |
 |
|---|
| Try MSlow |
 |
|---|
| ChTry MSlow |
 |
|---|
| ArgC MSlow |
 |
|---|
| LysN MSlow |
 |
|---|
| TryLysC MSlow |
 |
|---|
| Try MShigh |
 |
|---|
| ChTry MShigh |
 |
|---|
| ArgC MShigh |
 |
|---|
| LysN MShigh |
 |
|---|
| TryLysC MShigh |
 |
|---|
General Statistics
Number of major isoforms |
Number of additional isoforms |
Number of all proteins |
Number of amino acids |
Min. Seq. Length |
Max. Seq. Length |
Avg. Seq. Length |
Avg. Mol. Weight |
|---|---|---|---|---|---|---|---|
0 |
888 |
117 |
286 |
177.6 |
20.64 |
Amino acid frequency
Ala |
Cys |
Asp |
Glu |
Phe |
Gly |
His |
Ile |
Lys |
Leu |
|---|---|---|---|---|---|---|---|---|---|
3.829 ± 0.401 | 3.041 ± 0.707 |
5.518 ± 1.044 | 7.207 ± 0.779 |
4.505 ± 0.727 | 5.856 ± 0.775 |
1.464 ± 0.454 | 6.194 ± 0.398 |
6.982 ± 0.967 | 7.432 ± 0.975 |
Met |
Asn |
Gln |
Pro |
Arg |
Ser |
Thr |
Val |
Trp |
Tyr |
|---|---|---|---|---|---|---|---|---|---|
3.041 ± 0.528 | 3.829 ± 0.868 |
3.604 ± 0.604 | 3.153 ± 1.161 |
6.982 ± 0.95 | 7.432 ± 1.482 |
4.279 ± 0.819 | 8.221 ± 0.769 |
1.689 ± 0.108 | 5.743 ± 0.639 |
Most of the basic statistics you can see at this page can be downloaded from this CSV file
Proteome-pI is available under Creative Commons Attribution-NoDerivs license, for more details see here
| Reference: Kozlowski LP. Proteome-pI 2.0: Proteome Isoelectric Point Database Update. Nucleic Acids Res. 2021, doi: 10.1093/nar/gkab944 | Contact: Lukasz P. Kozlowski |
