Escherichia phage vB_Eco_SLUR26
Taxonomy: Viruses; Duplodnaviria; Heunggongvirae; Uroviricota; Caudoviricetes; Caudovirales; Siphoviridae; Queuovirinae; Seuratvirus; unclassified Seuratvirus
Average proteome isoelectric point is 6.51
Get precalculated fractions of proteins
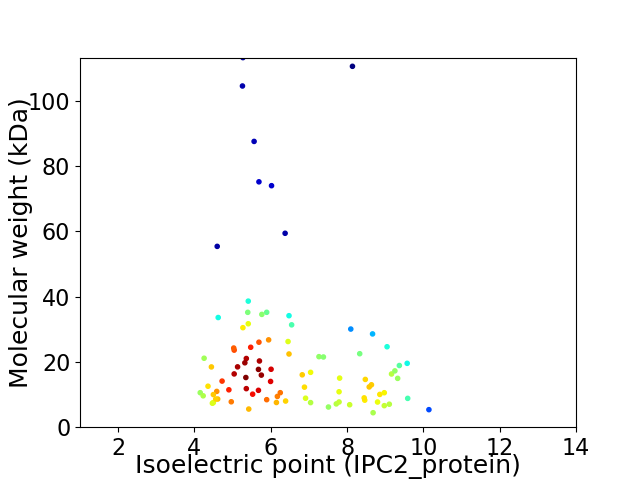
Virtual 2D-PAGE plot for 92 proteins (isoelectric point calculated using IPC2_protein)
Get csv file with sequences according to given criteria:
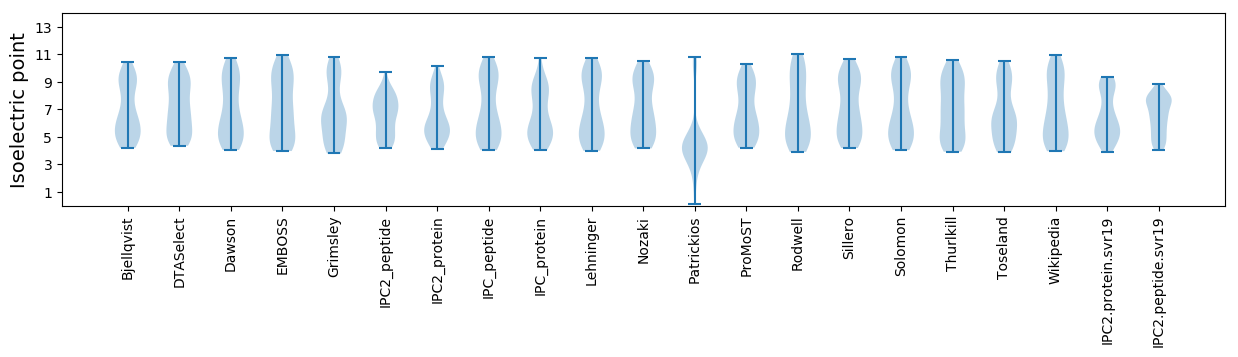
* You can choose from 21 different methods for calculating isoelectric point
Summary statistics related to proteome-wise predictions
Protein with the lowest isoelectric point:
>tr|A0A3B1E5U3|A0A3B1E5U3_9CAUD Uncharacterized protein OS=Escherichia phage vB_Eco_SLUR26 OX=2029173 GN=SLURMMXVI_30001 PE=4 SV=1
MM1 pKa = 7.36RR2 pKa = 11.84VEE4 pKa = 4.48EE5 pKa = 4.01IVEE8 pKa = 4.13GKK10 pKa = 9.87EE11 pKa = 3.61YY12 pKa = 10.96RR13 pKa = 11.84LLTDD17 pKa = 3.43IGGVGYY23 pKa = 8.53TPDD26 pKa = 3.2NAACFNVLPQGAIVTVNKK44 pKa = 9.97VVTDD48 pKa = 4.39LYY50 pKa = 10.96SVHH53 pKa = 7.46DD54 pKa = 4.51GRR56 pKa = 11.84WPHH59 pKa = 5.98AVIVTFGKK67 pKa = 10.28DD68 pKa = 3.12GYY70 pKa = 11.32VDD72 pKa = 5.34LDD74 pKa = 4.32GEE76 pKa = 4.64DD77 pKa = 3.45DD78 pKa = 4.01TYY80 pKa = 11.68EE81 pKa = 3.86VAYY84 pKa = 9.28TGLVSPNFLEE94 pKa = 4.59EE95 pKa = 4.0VV96 pKa = 3.43
MM1 pKa = 7.36RR2 pKa = 11.84VEE4 pKa = 4.48EE5 pKa = 4.01IVEE8 pKa = 4.13GKK10 pKa = 9.87EE11 pKa = 3.61YY12 pKa = 10.96RR13 pKa = 11.84LLTDD17 pKa = 3.43IGGVGYY23 pKa = 8.53TPDD26 pKa = 3.2NAACFNVLPQGAIVTVNKK44 pKa = 9.97VVTDD48 pKa = 4.39LYY50 pKa = 10.96SVHH53 pKa = 7.46DD54 pKa = 4.51GRR56 pKa = 11.84WPHH59 pKa = 5.98AVIVTFGKK67 pKa = 10.28DD68 pKa = 3.12GYY70 pKa = 11.32VDD72 pKa = 5.34LDD74 pKa = 4.32GEE76 pKa = 4.64DD77 pKa = 3.45DD78 pKa = 4.01TYY80 pKa = 11.68EE81 pKa = 3.86VAYY84 pKa = 9.28TGLVSPNFLEE94 pKa = 4.59EE95 pKa = 4.0VV96 pKa = 3.43
Molecular weight: 10.57 kDa
Isoelectric point according different methods:
Protein with the highest isoelectric point:
>tr|A0A3B1E3E3|A0A3B1E3E3_9CAUD Uncharacterized protein OS=Escherichia phage vB_Eco_SLUR26 OX=2029173 GN=SLURMMXVI_30004 PE=4 SV=1
MM1 pKa = 6.88FHH3 pKa = 7.16IFLFLLLQSFEE14 pKa = 4.16AAFDD18 pKa = 3.63DD19 pKa = 3.9FRR21 pKa = 11.84IYY23 pKa = 10.69HH24 pKa = 6.35RR25 pKa = 11.84AQYY28 pKa = 10.51RR29 pKa = 11.84DD30 pKa = 3.28AGSWRR35 pKa = 11.84GGRR38 pKa = 11.84CRR40 pKa = 11.84YY41 pKa = 9.19FLLRR45 pKa = 11.84LLRR48 pKa = 11.84FFMVAQHH55 pKa = 6.67LKK57 pKa = 10.66HH58 pKa = 6.55FLLDD62 pKa = 3.76DD63 pKa = 3.88VKK65 pKa = 10.51TDD67 pKa = 3.72LVLMDD72 pKa = 4.31KK73 pKa = 11.1LFVCVACNLTPTGLKK88 pKa = 8.88GTACIRR94 pKa = 11.84FHH96 pKa = 6.51GVAHH100 pKa = 6.98FILFAVSYY108 pKa = 8.83FRR110 pKa = 11.84HH111 pKa = 6.45GIAPFINISLLITAHH126 pKa = 7.12RR127 pKa = 11.84NDD129 pKa = 3.6EE130 pKa = 3.9QCIRR134 pKa = 11.84KK135 pKa = 9.65LIARR139 pKa = 11.84LLRR142 pKa = 11.84NRR144 pKa = 11.84RR145 pKa = 11.84LRR147 pKa = 11.84YY148 pKa = 8.41PCLRR152 pKa = 11.84KK153 pKa = 9.21QRR155 pKa = 11.84CYY157 pKa = 10.91SRR159 pKa = 11.84CRR161 pKa = 11.84CPRR164 pKa = 3.25
MM1 pKa = 6.88FHH3 pKa = 7.16IFLFLLLQSFEE14 pKa = 4.16AAFDD18 pKa = 3.63DD19 pKa = 3.9FRR21 pKa = 11.84IYY23 pKa = 10.69HH24 pKa = 6.35RR25 pKa = 11.84AQYY28 pKa = 10.51RR29 pKa = 11.84DD30 pKa = 3.28AGSWRR35 pKa = 11.84GGRR38 pKa = 11.84CRR40 pKa = 11.84YY41 pKa = 9.19FLLRR45 pKa = 11.84LLRR48 pKa = 11.84FFMVAQHH55 pKa = 6.67LKK57 pKa = 10.66HH58 pKa = 6.55FLLDD62 pKa = 3.76DD63 pKa = 3.88VKK65 pKa = 10.51TDD67 pKa = 3.72LVLMDD72 pKa = 4.31KK73 pKa = 11.1LFVCVACNLTPTGLKK88 pKa = 8.88GTACIRR94 pKa = 11.84FHH96 pKa = 6.51GVAHH100 pKa = 6.98FILFAVSYY108 pKa = 8.83FRR110 pKa = 11.84HH111 pKa = 6.45GIAPFINISLLITAHH126 pKa = 7.12RR127 pKa = 11.84NDD129 pKa = 3.6EE130 pKa = 3.9QCIRR134 pKa = 11.84KK135 pKa = 9.65LIARR139 pKa = 11.84LLRR142 pKa = 11.84NRR144 pKa = 11.84RR145 pKa = 11.84LRR147 pKa = 11.84YY148 pKa = 8.41PCLRR152 pKa = 11.84KK153 pKa = 9.21QRR155 pKa = 11.84CYY157 pKa = 10.91SRR159 pKa = 11.84CRR161 pKa = 11.84CPRR164 pKa = 3.25
Molecular weight: 19.56 kDa
Isoelectric point according different methods:
Peptides (in silico digests for buttom-up proteomics)
Below you can find in silico digests of the whole proteome with Trypsin, Chymotrypsin, Trypsin+LysC, LysN, ArgC proteases suitable for different mass spec machines.| Try ESI |
 |
|---|
| ChTry ESI |
|
|---|
| ArgC ESI |
|
|---|
| LysN ESI |
|
|---|
| TryLysC ESI |
|
|---|
| Try MALDI |
|
|---|
| ChTry MALDI |
|
|---|
| ArgC MALDI |
|
|---|
| LysN MALDI |
|
|---|
| TryLysC MALDI |
|
|---|
| Try LTQ |
|
|---|
| ChTry LTQ |
|
|---|
| ArgC LTQ |
|
|---|
| LysN LTQ |
|
|---|
| TryLysC LTQ |
|
|---|
| Try MSlow |
|
|---|
| ChTry MSlow |
|
|---|
| ArgC MSlow |
|
|---|
| LysN MSlow |
|
|---|
| TryLysC MSlow |
|
|---|
| Try MShigh |
|
|---|
| ChTry MShigh |
|
|---|
| ArgC MShigh |
|
|---|
| LysN MShigh |
|
|---|
| TryLysC MShigh |
|
|---|
General Statistics
Number of major isoforms |
Number of additional isoforms |
Number of all proteins |
Number of amino acids |
Min. Seq. Length |
Max. Seq. Length |
Avg. Seq. Length |
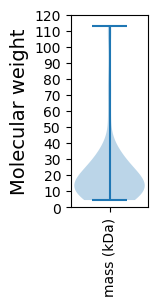
Avg. Mol. Weight |
|---|---|---|---|---|---|---|---|
0 |
18348 |
38 |
1040 |
199.4 |
22.23 |
Amino acid frequency
Ala |
Cys |
Asp |
Glu |
Phe |
Gly |
His |
Ile |
Lys |
Leu |
|---|---|---|---|---|---|---|---|---|---|
9.156 ± 0.58 | 1.461 ± 0.158 |
5.652 ± 0.177 | 6.399 ± 0.206 |
3.613 ± 0.182 | 7.183 ± 0.232 |
1.864 ± 0.177 | 5.892 ± 0.188 |
6.224 ± 0.269 | 7.565 ± 0.246 |
Met |
Asn |
Gln |
Pro |
Arg |
Ser |
Thr |
Val |
Trp |
Tyr |
|---|---|---|---|---|---|---|---|---|---|
2.861 ± 0.177 | 4.954 ± 0.171 |
4.175 ± 0.265 | 4.333 ± 0.29 |
5.036 ± 0.193 | 5.537 ± 0.275 |
5.924 ± 0.303 | 7.02 ± 0.18 |
1.559 ± 0.131 | 3.592 ± 0.152 |
Most of the basic statistics you can see at this page can be downloaded from this CSV file
See this proteome in:

Proteome-pI is available under Creative Commons Attribution-NoDerivs license, for more details see here
| Reference: Kozlowski LP. Proteome-pI 2.0: Proteome Isoelectric Point Database Update. Nucleic Acids Res. 2021, doi: 10.1093/nar/gkab944 | Contact: Lukasz P. Kozlowski |