Pelargonium vein banding virus
Taxonomy: Viruses; Riboviria; Pararnavirae; Artverviricota; Revtraviricetes; Ortervirales; Caulimoviridae; Badnavirus; unclassified Badnavirus
Average proteome isoelectric point is 7.02
Get precalculated fractions of proteins

Virtual 2D-PAGE plot for 3 proteins (isoelectric point calculated using IPC2_protein)
Get csv file with sequences according to given criteria:
* You can choose from 21 different methods for calculating isoelectric point
Summary statistics related to proteome-wise predictions


Protein with the lowest isoelectric point:
>tr|C9DT06|C9DT06_9VIRU Uncharacterized protein OS=Pelargonium vein banding virus OX=671126 PE=4 SV=1
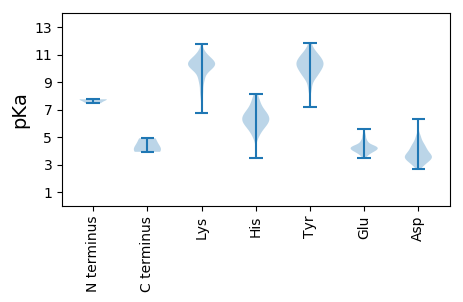
MM1 pKa = 7.75SEE3 pKa = 4.29RR4 pKa = 11.84FEE6 pKa = 3.93QAIQKK11 pKa = 8.73WYY13 pKa = 10.45NEE15 pKa = 3.75SRR17 pKa = 11.84TADD20 pKa = 3.75LRR22 pKa = 11.84YY23 pKa = 10.0LDD25 pKa = 5.15LATEE29 pKa = 4.36SPTVKK34 pKa = 10.31DD35 pKa = 3.58YY36 pKa = 11.79CSVINNNVSVIYY48 pKa = 10.4DD49 pKa = 3.53RR50 pKa = 11.84LLLHH54 pKa = 6.55SKK56 pKa = 10.18VAIKK60 pKa = 9.28DD61 pKa = 3.37TYY63 pKa = 10.83KK64 pKa = 10.53ILEE67 pKa = 4.32AQEE70 pKa = 4.18ANQDD74 pKa = 3.3ILVQEE79 pKa = 4.21IRR81 pKa = 11.84RR82 pKa = 11.84LSKK85 pKa = 10.2RR86 pKa = 11.84VKK88 pKa = 10.27ALEE91 pKa = 4.15AEE93 pKa = 4.25ALASKK98 pKa = 10.18PLTAEE103 pKa = 3.89QVRR106 pKa = 11.84EE107 pKa = 4.03LVKK110 pKa = 10.82EE111 pKa = 4.06IAAQPKK117 pKa = 9.83LVEE120 pKa = 4.04EE121 pKa = 4.28QAFKK125 pKa = 10.2LTTDD129 pKa = 3.54LRR131 pKa = 11.84SQVLQVKK138 pKa = 9.31EE139 pKa = 3.96LVEE142 pKa = 4.33KK143 pKa = 10.32VQHH146 pKa = 6.26LLVSS150 pKa = 4.15
MM1 pKa = 7.75SEE3 pKa = 4.29RR4 pKa = 11.84FEE6 pKa = 3.93QAIQKK11 pKa = 8.73WYY13 pKa = 10.45NEE15 pKa = 3.75SRR17 pKa = 11.84TADD20 pKa = 3.75LRR22 pKa = 11.84YY23 pKa = 10.0LDD25 pKa = 5.15LATEE29 pKa = 4.36SPTVKK34 pKa = 10.31DD35 pKa = 3.58YY36 pKa = 11.79CSVINNNVSVIYY48 pKa = 10.4DD49 pKa = 3.53RR50 pKa = 11.84LLLHH54 pKa = 6.55SKK56 pKa = 10.18VAIKK60 pKa = 9.28DD61 pKa = 3.37TYY63 pKa = 10.83KK64 pKa = 10.53ILEE67 pKa = 4.32AQEE70 pKa = 4.18ANQDD74 pKa = 3.3ILVQEE79 pKa = 4.21IRR81 pKa = 11.84RR82 pKa = 11.84LSKK85 pKa = 10.2RR86 pKa = 11.84VKK88 pKa = 10.27ALEE91 pKa = 4.15AEE93 pKa = 4.25ALASKK98 pKa = 10.18PLTAEE103 pKa = 3.89QVRR106 pKa = 11.84EE107 pKa = 4.03LVKK110 pKa = 10.82EE111 pKa = 4.06IAAQPKK117 pKa = 9.83LVEE120 pKa = 4.04EE121 pKa = 4.28QAFKK125 pKa = 10.2LTTDD129 pKa = 3.54LRR131 pKa = 11.84SQVLQVKK138 pKa = 9.31EE139 pKa = 3.96LVEE142 pKa = 4.33KK143 pKa = 10.32VQHH146 pKa = 6.26LLVSS150 pKa = 4.15
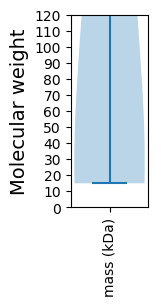
Molecular weight: 17.27 kDa
Isoelectric point according different methods:
Protein with the highest isoelectric point:
>tr|C9DT07|C9DT07_9VIRU Reverse transcriptase OS=Pelargonium vein banding virus OX=671126 PE=4 SV=1
MM1 pKa = 7.46SRR3 pKa = 11.84PDD5 pKa = 3.23SATTAEE11 pKa = 4.57YY12 pKa = 10.16IAAAQATEE20 pKa = 4.11ALGSPAEE27 pKa = 4.41GFLSVKK33 pKa = 10.23NIPPGSSSQTALLIKK48 pKa = 10.35QNNFLLEE55 pKa = 4.18LVLDD59 pKa = 3.85LHH61 pKa = 6.9RR62 pKa = 11.84KK63 pKa = 8.29INGVEE68 pKa = 3.85ARR70 pKa = 11.84LSRR73 pKa = 11.84AKK75 pKa = 10.43EE76 pKa = 3.74PAEE79 pKa = 4.24GSQGQGLEE87 pKa = 4.22EE88 pKa = 5.03IIQKK92 pKa = 10.1LDD94 pKa = 3.13KK95 pKa = 11.16LKK97 pKa = 10.83IGDD100 pKa = 4.3GEE102 pKa = 4.42QKK104 pKa = 8.24THH106 pKa = 6.6SIKK109 pKa = 11.0GPGKK113 pKa = 9.13VYY115 pKa = 9.99FYY117 pKa = 10.82RR118 pKa = 11.84DD119 pKa = 3.51PKK121 pKa = 11.05ALAEE125 pKa = 4.05EE126 pKa = 4.37EE127 pKa = 3.95RR128 pKa = 11.84RR129 pKa = 11.84KK130 pKa = 10.73AKK132 pKa = 10.12LRR134 pKa = 11.84YY135 pKa = 9.09AA136 pKa = 3.92
MM1 pKa = 7.46SRR3 pKa = 11.84PDD5 pKa = 3.23SATTAEE11 pKa = 4.57YY12 pKa = 10.16IAAAQATEE20 pKa = 4.11ALGSPAEE27 pKa = 4.41GFLSVKK33 pKa = 10.23NIPPGSSSQTALLIKK48 pKa = 10.35QNNFLLEE55 pKa = 4.18LVLDD59 pKa = 3.85LHH61 pKa = 6.9RR62 pKa = 11.84KK63 pKa = 8.29INGVEE68 pKa = 3.85ARR70 pKa = 11.84LSRR73 pKa = 11.84AKK75 pKa = 10.43EE76 pKa = 3.74PAEE79 pKa = 4.24GSQGQGLEE87 pKa = 4.22EE88 pKa = 5.03IIQKK92 pKa = 10.1LDD94 pKa = 3.13KK95 pKa = 11.16LKK97 pKa = 10.83IGDD100 pKa = 4.3GEE102 pKa = 4.42QKK104 pKa = 8.24THH106 pKa = 6.6SIKK109 pKa = 11.0GPGKK113 pKa = 9.13VYY115 pKa = 9.99FYY117 pKa = 10.82RR118 pKa = 11.84DD119 pKa = 3.51PKK121 pKa = 11.05ALAEE125 pKa = 4.05EE126 pKa = 4.37EE127 pKa = 3.95RR128 pKa = 11.84RR129 pKa = 11.84KK130 pKa = 10.73AKK132 pKa = 10.12LRR134 pKa = 11.84YY135 pKa = 9.09AA136 pKa = 3.92
Molecular weight: 14.86 kDa
Isoelectric point according different methods:
Peptides (in silico digests for buttom-up proteomics)
Below you can find in silico digests of the whole proteome with Trypsin, Chymotrypsin, Trypsin+LysC, LysN, ArgC proteases suitable for different mass spec machines.| Try ESI |
 |
|---|
| ChTry ESI |
 |
|---|
| ArgC ESI |
 |
|---|
| LysN ESI |
 |
|---|
| TryLysC ESI |
 |
|---|
| Try MALDI |
 |
|---|
| ChTry MALDI |
 |
|---|
| ArgC MALDI |
 |
|---|
| LysN MALDI |
 |
|---|
| TryLysC MALDI |
 |
|---|
| Try LTQ |
 |
|---|
| ChTry LTQ |
 |
|---|
| ArgC LTQ |
 |
|---|
| LysN LTQ |
 |
|---|
| TryLysC LTQ |
 |
|---|
| Try MSlow |
 |
|---|
| ChTry MSlow |
 |
|---|
| ArgC MSlow |
 |
|---|
| LysN MSlow |
 |
|---|
| TryLysC MSlow |
 |
|---|
| Try MShigh |
 |
|---|
| ChTry MShigh |
 |
|---|
| ArgC MShigh |
 |
|---|
| LysN MShigh |
 |
|---|
| TryLysC MShigh |
 |
|---|
General Statistics
Number of major isoforms |
Number of additional isoforms |
Number of all proteins |
Number of amino acids |
Min. Seq. Length |
Max. Seq. Length |
Avg. Seq. Length |
Avg. Mol. Weight |
|---|---|---|---|---|---|---|---|
0 |
2256 |
136 |
1970 |
752.0 |
85.23 |
Amino acid frequency
Ala |
Cys |
Asp |
Glu |
Phe |
Gly |
His |
Ile |
Lys |
Leu |
|---|---|---|---|---|---|---|---|---|---|
7.979 ± 1.301 | 1.463 ± 0.558 |
5.053 ± 0.454 | 8.333 ± 0.88 |
2.97 ± 0.597 | 5.541 ± 1.422 |
1.995 ± 0.288 | 6.161 ± 0.281 |
6.693 ± 1.182 | 8.732 ± 1.71 |
Met |
Asn |
Gln |
Pro |
Arg |
Ser |
Thr |
Val |
Trp |
Tyr |
|---|---|---|---|---|---|---|---|---|---|
2.261 ± 0.757 | 4.167 ± 0.503 |
5.674 ± 1.125 | 4.787 ± 0.779 |
6.738 ± 0.387 | 6.25 ± 0.383 |
4.965 ± 0.413 | 5.496 ± 1.167 |
1.418 ± 0.536 | 3.324 ± 0.109 |
Most of the basic statistics you can see at this page can be downloaded from this CSV file
Proteome-pI is available under Creative Commons Attribution-NoDerivs license, for more details see here
| Reference: Kozlowski LP. Proteome-pI 2.0: Proteome Isoelectric Point Database Update. Nucleic Acids Res. 2021, doi: 10.1093/nar/gkab944 | Contact: Lukasz P. Kozlowski |
