Drosophila ananassae (Fruit fly)
Taxonomy: cellular organisms; Eukaryota; Opisthokonta; Metazoa; Eumetazoa; Bilateria; Protostomia; Ecdysozoa; Panarthropoda; Arthropoda; Mandibulata; Pancrustacea; Hexapoda; Insecta; Dicondylia; Pterygota; Neoptera; Endopterygota; Diptera; Brachycera; Muscomorpha; Eremoneura; Cyclorrhapha;
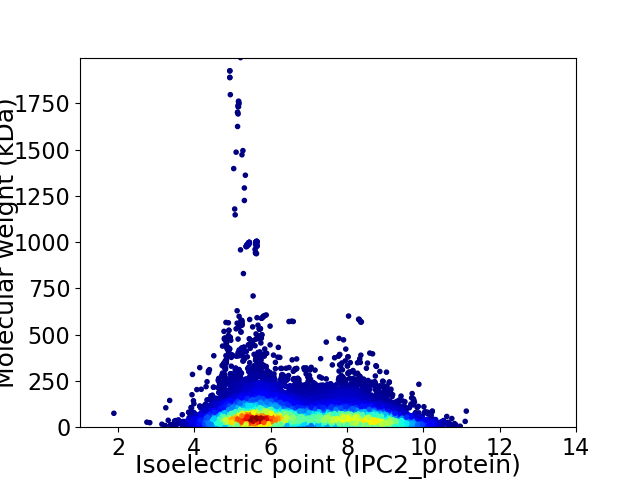
Average proteome isoelectric point is 6.7
Get precalculated fractions of proteins

Virtual 2D-PAGE plot for 19363 proteins (isoelectric point calculated using IPC2_protein)
Get csv file with sequences according to given criteria:
* You can choose from 21 different methods for calculating isoelectric point
Summary statistics related to proteome-wise predictions


Protein with the lowest isoelectric point:
>tr|B3MYL3|B3MYL3_DROAN Uncharacterized protein OS=Drosophila ananassae OX=7217 GN=Dana\GF22009 PE=4 SV=1
MM1 pKa = 7.23IAEE4 pKa = 4.21ALEE7 pKa = 3.93FLFDD11 pKa = 3.87RR12 pKa = 11.84LPYY15 pKa = 10.24EE16 pKa = 4.24SEE18 pKa = 4.04EE19 pKa = 5.04DD20 pKa = 3.32ICDD23 pKa = 3.64MPEE26 pKa = 3.88SLLVLACVLGVLIFVTYY43 pKa = 10.56ILIRR47 pKa = 11.84TDD49 pKa = 2.94ADD51 pKa = 3.29IYY53 pKa = 9.84PLYY56 pKa = 10.39PEE58 pKa = 4.04VHH60 pKa = 6.99PDD62 pKa = 3.66DD63 pKa = 5.03EE64 pKa = 4.54EE65 pKa = 6.94LIDD68 pKa = 5.06DD69 pKa = 5.17LARR72 pKa = 11.84GLNQNLNNWLINGRR86 pKa = 11.84GLAPNDD92 pKa = 3.89RR93 pKa = 11.84NLQQ96 pKa = 3.56
MM1 pKa = 7.23IAEE4 pKa = 4.21ALEE7 pKa = 3.93FLFDD11 pKa = 3.87RR12 pKa = 11.84LPYY15 pKa = 10.24EE16 pKa = 4.24SEE18 pKa = 4.04EE19 pKa = 5.04DD20 pKa = 3.32ICDD23 pKa = 3.64MPEE26 pKa = 3.88SLLVLACVLGVLIFVTYY43 pKa = 10.56ILIRR47 pKa = 11.84TDD49 pKa = 2.94ADD51 pKa = 3.29IYY53 pKa = 9.84PLYY56 pKa = 10.39PEE58 pKa = 4.04VHH60 pKa = 6.99PDD62 pKa = 3.66DD63 pKa = 5.03EE64 pKa = 4.54EE65 pKa = 6.94LIDD68 pKa = 5.06DD69 pKa = 5.17LARR72 pKa = 11.84GLNQNLNNWLINGRR86 pKa = 11.84GLAPNDD92 pKa = 3.89RR93 pKa = 11.84NLQQ96 pKa = 3.56
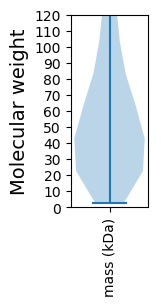
Molecular weight: 10.99 kDa
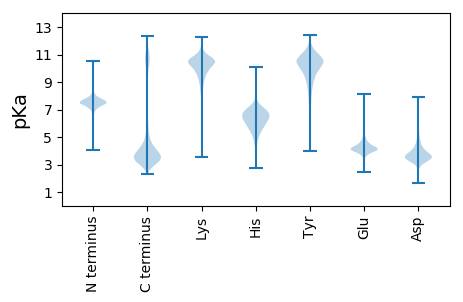
Isoelectric point according different methods:
Protein with the highest isoelectric point:
>tr|A0A0P9C355|A0A0P9C355_DROAN Uncharacterized protein isoform B OS=Drosophila ananassae OX=7217 GN=Dana\GF10107 PE=4 SV=1
MM1 pKa = 7.2KK2 pKa = 10.08FVWAIVGLLFCLTLDD17 pKa = 3.97QANGTPGEE25 pKa = 4.32SGIKK29 pKa = 9.3PPVWNLPTPRR39 pKa = 11.84RR40 pKa = 11.84TPPRR44 pKa = 11.84PPTPVGLPIRR54 pKa = 11.84RR55 pKa = 11.84PPISPPRR62 pKa = 11.84APVMWRR68 pKa = 11.84PFPRR72 pKa = 11.84PAPRR76 pKa = 11.84TPPPIRR82 pKa = 11.84RR83 pKa = 11.84PPVTRR88 pKa = 11.84KK89 pKa = 9.43PPPRR93 pKa = 11.84NPPPTRR99 pKa = 11.84RR100 pKa = 11.84PPITRR105 pKa = 11.84RR106 pKa = 11.84PTQRR110 pKa = 11.84PAPKK114 pKa = 9.62PLIPTTRR121 pKa = 11.84KK122 pKa = 8.95FLIWTRR128 pKa = 11.84IPTRR132 pKa = 11.84IVPTKK137 pKa = 10.05PNIRR141 pKa = 11.84PTLWTRR147 pKa = 11.84RR148 pKa = 11.84PLPTIRR154 pKa = 11.84PTRR157 pKa = 11.84PRR159 pKa = 11.84IRR161 pKa = 11.84PTLWTRR167 pKa = 11.84PPIKK171 pKa = 9.14ITARR175 pKa = 11.84PRR177 pKa = 11.84PTVRR181 pKa = 11.84ATIRR185 pKa = 11.84PTARR189 pKa = 11.84PPSPTRR195 pKa = 11.84VTKK198 pKa = 10.52RR199 pKa = 11.84PQKK202 pKa = 9.91PRR204 pKa = 11.84TGATLWTRR212 pKa = 11.84PPGRR216 pKa = 11.84NPTTRR221 pKa = 11.84QLTFIFEE228 pKa = 4.61TPQPTTQRR236 pKa = 11.84PRR238 pKa = 11.84PRR240 pKa = 11.84EE241 pKa = 3.86PPRR244 pKa = 11.84SGSTRR249 pKa = 11.84SLIFIFTTRR258 pKa = 11.84RR259 pKa = 11.84PNRR262 pKa = 11.84TVHH265 pKa = 5.64PTGHH269 pKa = 5.41TRR271 pKa = 11.84KK272 pKa = 9.97SS273 pKa = 3.21
MM1 pKa = 7.2KK2 pKa = 10.08FVWAIVGLLFCLTLDD17 pKa = 3.97QANGTPGEE25 pKa = 4.32SGIKK29 pKa = 9.3PPVWNLPTPRR39 pKa = 11.84RR40 pKa = 11.84TPPRR44 pKa = 11.84PPTPVGLPIRR54 pKa = 11.84RR55 pKa = 11.84PPISPPRR62 pKa = 11.84APVMWRR68 pKa = 11.84PFPRR72 pKa = 11.84PAPRR76 pKa = 11.84TPPPIRR82 pKa = 11.84RR83 pKa = 11.84PPVTRR88 pKa = 11.84KK89 pKa = 9.43PPPRR93 pKa = 11.84NPPPTRR99 pKa = 11.84RR100 pKa = 11.84PPITRR105 pKa = 11.84RR106 pKa = 11.84PTQRR110 pKa = 11.84PAPKK114 pKa = 9.62PLIPTTRR121 pKa = 11.84KK122 pKa = 8.95FLIWTRR128 pKa = 11.84IPTRR132 pKa = 11.84IVPTKK137 pKa = 10.05PNIRR141 pKa = 11.84PTLWTRR147 pKa = 11.84RR148 pKa = 11.84PLPTIRR154 pKa = 11.84PTRR157 pKa = 11.84PRR159 pKa = 11.84IRR161 pKa = 11.84PTLWTRR167 pKa = 11.84PPIKK171 pKa = 9.14ITARR175 pKa = 11.84PRR177 pKa = 11.84PTVRR181 pKa = 11.84ATIRR185 pKa = 11.84PTARR189 pKa = 11.84PPSPTRR195 pKa = 11.84VTKK198 pKa = 10.52RR199 pKa = 11.84PQKK202 pKa = 9.91PRR204 pKa = 11.84TGATLWTRR212 pKa = 11.84PPGRR216 pKa = 11.84NPTTRR221 pKa = 11.84QLTFIFEE228 pKa = 4.61TPQPTTQRR236 pKa = 11.84PRR238 pKa = 11.84PRR240 pKa = 11.84EE241 pKa = 3.86PPRR244 pKa = 11.84SGSTRR249 pKa = 11.84SLIFIFTTRR258 pKa = 11.84RR259 pKa = 11.84PNRR262 pKa = 11.84TVHH265 pKa = 5.64PTGHH269 pKa = 5.41TRR271 pKa = 11.84KK272 pKa = 9.97SS273 pKa = 3.21
Molecular weight: 31.37 kDa
Isoelectric point according different methods:
Peptides (in silico digests for buttom-up proteomics)
Below you can find in silico digests of the whole proteome with Trypsin, Chymotrypsin, Trypsin+LysC, LysN, ArgC proteases suitable for different mass spec machines.| Try ESI |
 |
|---|
| ChTry ESI |
 |
|---|
| ArgC ESI |
 |
|---|
| LysN ESI |
 |
|---|
| TryLysC ESI |
 |
|---|
| Try MALDI |
 |
|---|
| ChTry MALDI |
 |
|---|
| ArgC MALDI |
 |
|---|
| LysN MALDI |
 |
|---|
| TryLysC MALDI |
 |
|---|
| Try LTQ |
 |
|---|
| ChTry LTQ |
 |
|---|
| ArgC LTQ |
 |
|---|
| LysN LTQ |
 |
|---|
| TryLysC LTQ |
 |
|---|
| Try MSlow |
 |
|---|
| ChTry MSlow |
 |
|---|
| ArgC MSlow |
 |
|---|
| LysN MSlow |
 |
|---|
| TryLysC MSlow |
 |
|---|
| Try MShigh |
 |
|---|
| ChTry MShigh |
 |
|---|
| ArgC MShigh |
 |
|---|
| LysN MShigh |
 |
|---|
| TryLysC MShigh |
 |
|---|
General Statistics
Number of major isoforms |
Number of additional isoforms |
Number of all proteins |
Number of amino acids |
Min. Seq. Length |
Max. Seq. Length |
Avg. Seq. Length |
Avg. Mol. Weight |
|---|---|---|---|---|---|---|---|
12990802 |
21 |
18780 |
670.9 |
74.62 |
Amino acid frequency
Ala |
Cys |
Asp |
Glu |
Phe |
Gly |
His |
Ile |
Lys |
Leu |
|---|---|---|---|---|---|---|---|---|---|
7.394 ± 0.022 | 1.991 ± 0.067 |
5.257 ± 0.016 | 6.674 ± 0.032 |
3.346 ± 0.016 | 6.243 ± 0.026 |
2.57 ± 0.011 | 4.819 ± 0.017 |
5.651 ± 0.029 | 8.795 ± 0.038 |
Met |
Asn |
Gln |
Pro |
Arg |
Ser |
Thr |
Val |
Trp |
Tyr |
|---|---|---|---|---|---|---|---|---|---|
2.192 ± 0.012 | 4.708 ± 0.017 |
5.849 ± 0.038 | 5.27 ± 0.024 |
5.535 ± 0.014 | 8.362 ± 0.029 |
5.717 ± 0.02 | 5.857 ± 0.015 |
0.95 ± 0.007 | 2.817 ± 0.011 |
Most of the basic statistics you can see at this page can be downloaded from this CSV file
Proteome-pI is available under Creative Commons Attribution-NoDerivs license, for more details see here
| Reference: Kozlowski LP. Proteome-pI 2.0: Proteome Isoelectric Point Database Update. Nucleic Acids Res. 2021, doi: 10.1093/nar/gkab944 | Contact: Lukasz P. Kozlowski |
