[Candida] arabinofermentans NRRL YB-2248
Taxonomy: cellular organisms; Eukaryota; Opisthokonta; Fungi; Dikarya; Ascomycota; saccharomyceta; Saccharomycotina; Saccharomycetes; Saccharomycetales; Pichiaceae; Ogataea; Ogataea/Candida clade; [Candida] arabinofermentans
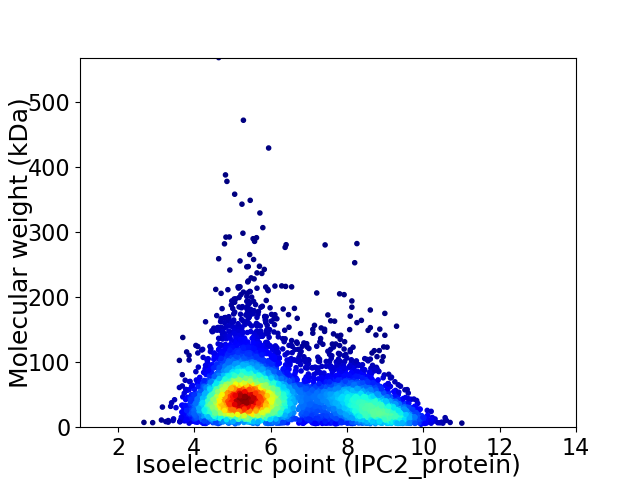
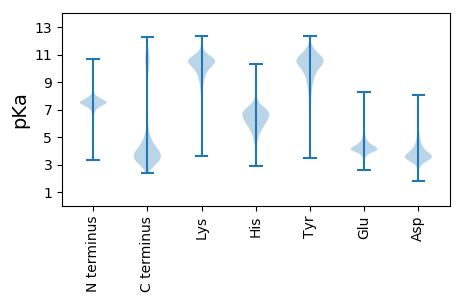
Average proteome isoelectric point is 6.27
Get precalculated fractions of proteins

Virtual 2D-PAGE plot for 5827 proteins (isoelectric point calculated using IPC2_protein)
Get csv file with sequences according to given criteria:
* You can choose from 21 different methods for calculating isoelectric point
Summary statistics related to proteome-wise predictions


Protein with the lowest isoelectric point:
>tr|A0A1E4SYK6|A0A1E4SYK6_9ASCO Sm domain-containing protein OS=[Candida] arabinofermentans NRRL YB-2248 OX=983967 GN=CANARDRAFT_200819 PE=3 SV=1
MM1 pKa = 7.14NRR3 pKa = 11.84STSTSEE9 pKa = 3.63IQSISASSIITDD21 pKa = 3.76TDD23 pKa = 3.01EE24 pKa = 4.18SAYY27 pKa = 9.65FTDD30 pKa = 4.32ADD32 pKa = 3.88SHH34 pKa = 5.78FTDD37 pKa = 5.12TEE39 pKa = 4.44LNDD42 pKa = 4.14NNNDD46 pKa = 3.43NNNNNGIADD55 pKa = 4.08SVGDD59 pKa = 3.97GAPLSTQVTATDD71 pKa = 3.81NNNDD75 pKa = 3.48NNDD78 pKa = 3.39IADD81 pKa = 3.61QTIVEE86 pKa = 4.37SHH88 pKa = 5.75QLPNNDD94 pKa = 4.44NNDD97 pKa = 2.94IDD99 pKa = 3.93QRR101 pKa = 11.84SGNVPITPDD110 pKa = 3.81DD111 pKa = 4.48VISIQPKK118 pKa = 9.12KK119 pKa = 9.98QLEE122 pKa = 4.19PTMSNNEE129 pKa = 3.8NNKK132 pKa = 10.02AFISTDD138 pKa = 3.47DD139 pKa = 3.76NNAAIADD146 pKa = 3.75ASVQVGDD153 pKa = 4.63DD154 pKa = 3.88NEE156 pKa = 4.0ILAQKK161 pKa = 10.19RR162 pKa = 11.84GYY164 pKa = 9.89QRR166 pKa = 11.84DD167 pKa = 3.29EE168 pKa = 4.6SEE170 pKa = 4.04CHH172 pKa = 6.21EE173 pKa = 4.6YY174 pKa = 11.01YY175 pKa = 11.13CNFTCFDD182 pKa = 4.47DD183 pKa = 4.72LKK185 pKa = 10.76CDD187 pKa = 3.43SGEE190 pKa = 4.6NICIMCFSCLVSSFTSVCISLCQSSASKK218 pKa = 10.86
MM1 pKa = 7.14NRR3 pKa = 11.84STSTSEE9 pKa = 3.63IQSISASSIITDD21 pKa = 3.76TDD23 pKa = 3.01EE24 pKa = 4.18SAYY27 pKa = 9.65FTDD30 pKa = 4.32ADD32 pKa = 3.88SHH34 pKa = 5.78FTDD37 pKa = 5.12TEE39 pKa = 4.44LNDD42 pKa = 4.14NNNDD46 pKa = 3.43NNNNNGIADD55 pKa = 4.08SVGDD59 pKa = 3.97GAPLSTQVTATDD71 pKa = 3.81NNNDD75 pKa = 3.48NNDD78 pKa = 3.39IADD81 pKa = 3.61QTIVEE86 pKa = 4.37SHH88 pKa = 5.75QLPNNDD94 pKa = 4.44NNDD97 pKa = 2.94IDD99 pKa = 3.93QRR101 pKa = 11.84SGNVPITPDD110 pKa = 3.81DD111 pKa = 4.48VISIQPKK118 pKa = 9.12KK119 pKa = 9.98QLEE122 pKa = 4.19PTMSNNEE129 pKa = 3.8NNKK132 pKa = 10.02AFISTDD138 pKa = 3.47DD139 pKa = 3.76NNAAIADD146 pKa = 3.75ASVQVGDD153 pKa = 4.63DD154 pKa = 3.88NEE156 pKa = 4.0ILAQKK161 pKa = 10.19RR162 pKa = 11.84GYY164 pKa = 9.89QRR166 pKa = 11.84DD167 pKa = 3.29EE168 pKa = 4.6SEE170 pKa = 4.04CHH172 pKa = 6.21EE173 pKa = 4.6YY174 pKa = 11.01YY175 pKa = 11.13CNFTCFDD182 pKa = 4.47DD183 pKa = 4.72LKK185 pKa = 10.76CDD187 pKa = 3.43SGEE190 pKa = 4.6NICIMCFSCLVSSFTSVCISLCQSSASKK218 pKa = 10.86
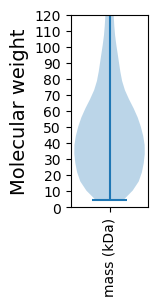
Molecular weight: 23.74 kDa
Isoelectric point according different methods:
Protein with the highest isoelectric point:
>tr|A0A1E4T4N6|A0A1E4T4N6_9ASCO G-patch domain-containing protein OS=[Candida] arabinofermentans NRRL YB-2248 OX=983967 GN=CANARDRAFT_6210 PE=3 SV=1
MM1 pKa = 7.94PSQKK5 pKa = 10.41SFRR8 pKa = 11.84TKK10 pKa = 10.38QKK12 pKa = 10.07LAKK15 pKa = 9.76AQNQNRR21 pKa = 11.84PLPQWIRR28 pKa = 11.84LRR30 pKa = 11.84TNNKK34 pKa = 8.41IRR36 pKa = 11.84YY37 pKa = 5.78NAKK40 pKa = 8.42RR41 pKa = 11.84RR42 pKa = 11.84HH43 pKa = 4.6WKK45 pKa = 8.07RR46 pKa = 11.84TKK48 pKa = 10.75LGII51 pKa = 3.98
MM1 pKa = 7.94PSQKK5 pKa = 10.41SFRR8 pKa = 11.84TKK10 pKa = 10.38QKK12 pKa = 10.07LAKK15 pKa = 9.76AQNQNRR21 pKa = 11.84PLPQWIRR28 pKa = 11.84LRR30 pKa = 11.84TNNKK34 pKa = 8.41IRR36 pKa = 11.84YY37 pKa = 5.78NAKK40 pKa = 8.42RR41 pKa = 11.84RR42 pKa = 11.84HH43 pKa = 4.6WKK45 pKa = 8.07RR46 pKa = 11.84TKK48 pKa = 10.75LGII51 pKa = 3.98
Molecular weight: 6.29 kDa
Isoelectric point according different methods:
Peptides (in silico digests for buttom-up proteomics)
Below you can find in silico digests of the whole proteome with Trypsin, Chymotrypsin, Trypsin+LysC, LysN, ArgC proteases suitable for different mass spec machines.| Try ESI |
 |
|---|
| ChTry ESI |
 |
|---|
| ArgC ESI |
 |
|---|
| LysN ESI |
 |
|---|
| TryLysC ESI |
 |
|---|
| Try MALDI |
 |
|---|
| ChTry MALDI |
 |
|---|
| ArgC MALDI |
 |
|---|
| LysN MALDI |
 |
|---|
| TryLysC MALDI |
 |
|---|
| Try LTQ |
 |
|---|
| ChTry LTQ |
 |
|---|
| ArgC LTQ |
 |
|---|
| LysN LTQ |
 |
|---|
| TryLysC LTQ |
 |
|---|
| Try MSlow |
 |
|---|
| ChTry MSlow |
 |
|---|
| ArgC MSlow |
 |
|---|
| LysN MSlow |
 |
|---|
| TryLysC MSlow |
 |
|---|
| Try MShigh |
 |
|---|
| ChTry MShigh |
 |
|---|
| ArgC MShigh |
 |
|---|
| LysN MShigh |
 |
|---|
| TryLysC MShigh |
 |
|---|
General Statistics
Number of major isoforms |
Number of additional isoforms |
Number of all proteins |
Number of amino acids |
Min. Seq. Length |
Max. Seq. Length |
Avg. Seq. Length |
Avg. Mol. Weight |
|---|---|---|---|---|---|---|---|
2735454 |
49 |
5024 |
469.4 |
52.96 |
Amino acid frequency
Ala |
Cys |
Asp |
Glu |
Phe |
Gly |
His |
Ile |
Lys |
Leu |
|---|---|---|---|---|---|---|---|---|---|
5.185 ± 0.031 | 1.193 ± 0.012 |
6.201 ± 0.026 | 6.52 ± 0.031 |
4.411 ± 0.021 | 5.094 ± 0.029 |
1.933 ± 0.013 | 6.908 ± 0.025 |
7.29 ± 0.03 | 9.808 ± 0.035 |
Met |
Asn |
Gln |
Pro |
Arg |
Ser |
Thr |
Val |
Trp |
Tyr |
|---|---|---|---|---|---|---|---|---|---|
2.065 ± 0.01 | 5.971 ± 0.026 |
4.209 ± 0.025 | 4.138 ± 0.034 |
3.873 ± 0.019 | 9.374 ± 0.038 |
5.939 ± 0.025 | 5.43 ± 0.022 |
0.96 ± 0.008 | 3.49 ± 0.018 |
Most of the basic statistics you can see at this page can be downloaded from this CSV file
Proteome-pI is available under Creative Commons Attribution-NoDerivs license, for more details see here
| Reference: Kozlowski LP. Proteome-pI 2.0: Proteome Isoelectric Point Database Update. Nucleic Acids Res. 2021, doi: 10.1093/nar/gkab944 | Contact: Lukasz P. Kozlowski |
