Sphingobacterium deserti
Taxonomy: cellular organisms; Bacteria; FCB group; Bacteroidetes/Chlorobi group; Bacteroidetes; Sphingobacteriia; Sphingobacteriales; Sphingobacteriaceae; Sphingobacterium
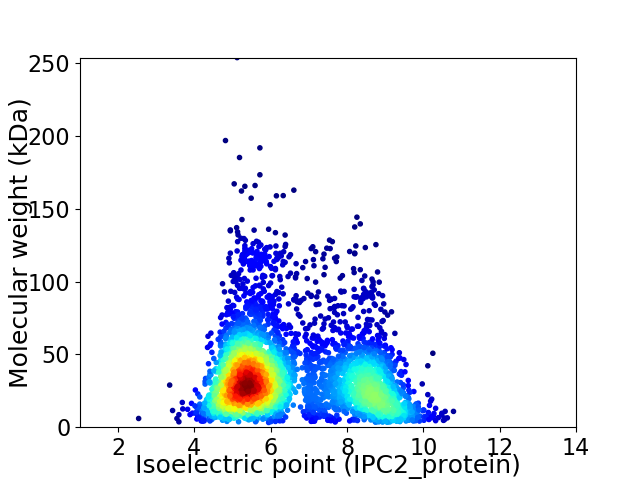
Average proteome isoelectric point is 6.51
Get precalculated fractions of proteins

Virtual 2D-PAGE plot for 3969 proteins (isoelectric point calculated using IPC2_protein)
Get csv file with sequences according to given criteria:
* You can choose from 21 different methods for calculating isoelectric point
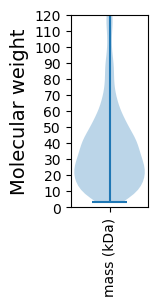
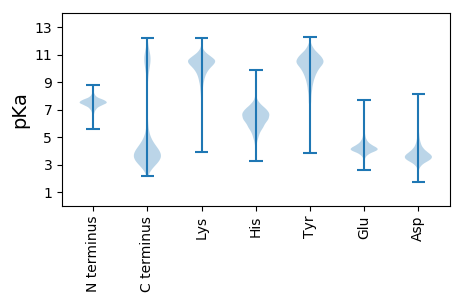
Summary statistics related to proteome-wise predictions


Protein with the lowest isoelectric point:
>tr|A0A0B8T3A5|A0A0B8T3A5_9SPHI RND efflux system outer membrane lipoprotein NodT family OS=Sphingobacterium deserti OX=1229276 GN=DI53_0112 PE=3 SV=1
MM1 pKa = 7.76IDD3 pKa = 4.42DD4 pKa = 4.28KK5 pKa = 11.62LGLKK9 pKa = 9.39SWSEE13 pKa = 4.13DD14 pKa = 3.4PAFLAQLYY22 pKa = 10.72SFAQANGSGSFYY34 pKa = 10.68AIWNDD39 pKa = 3.38GTAKK43 pKa = 10.26PMSEE47 pKa = 3.87MPIVVFGDD55 pKa = 3.18EE56 pKa = 4.41GGVHH60 pKa = 6.15IVAEE64 pKa = 4.18NFVQLLHH71 pKa = 6.98LLTFDD76 pKa = 3.83TEE78 pKa = 3.96IHH80 pKa = 6.06VDD82 pKa = 3.98FDD84 pKa = 3.55GVYY87 pKa = 9.92FYY89 pKa = 11.17KK90 pKa = 10.81DD91 pKa = 3.16EE92 pKa = 4.16EE93 pKa = 4.6DD94 pKa = 4.01YY95 pKa = 11.63EE96 pKa = 4.21EE97 pKa = 5.95SEE99 pKa = 4.46DD100 pKa = 5.1LEE102 pKa = 5.01EE103 pKa = 4.19FLDD106 pKa = 4.01WVKK109 pKa = 11.12EE110 pKa = 3.99NYY112 pKa = 10.41GLDD115 pKa = 3.62QIEE118 pKa = 4.59EE119 pKa = 4.28PDD121 pKa = 3.86EE122 pKa = 4.22LMEE125 pKa = 4.5AAQSKK130 pKa = 8.08YY131 pKa = 8.0QAVFEE136 pKa = 4.7DD137 pKa = 3.65WFGQYY142 pKa = 10.8YY143 pKa = 10.32SDD145 pKa = 4.64EE146 pKa = 4.29EE147 pKa = 4.2
MM1 pKa = 7.76IDD3 pKa = 4.42DD4 pKa = 4.28KK5 pKa = 11.62LGLKK9 pKa = 9.39SWSEE13 pKa = 4.13DD14 pKa = 3.4PAFLAQLYY22 pKa = 10.72SFAQANGSGSFYY34 pKa = 10.68AIWNDD39 pKa = 3.38GTAKK43 pKa = 10.26PMSEE47 pKa = 3.87MPIVVFGDD55 pKa = 3.18EE56 pKa = 4.41GGVHH60 pKa = 6.15IVAEE64 pKa = 4.18NFVQLLHH71 pKa = 6.98LLTFDD76 pKa = 3.83TEE78 pKa = 3.96IHH80 pKa = 6.06VDD82 pKa = 3.98FDD84 pKa = 3.55GVYY87 pKa = 9.92FYY89 pKa = 11.17KK90 pKa = 10.81DD91 pKa = 3.16EE92 pKa = 4.16EE93 pKa = 4.6DD94 pKa = 4.01YY95 pKa = 11.63EE96 pKa = 4.21EE97 pKa = 5.95SEE99 pKa = 4.46DD100 pKa = 5.1LEE102 pKa = 5.01EE103 pKa = 4.19FLDD106 pKa = 4.01WVKK109 pKa = 11.12EE110 pKa = 3.99NYY112 pKa = 10.41GLDD115 pKa = 3.62QIEE118 pKa = 4.59EE119 pKa = 4.28PDD121 pKa = 3.86EE122 pKa = 4.22LMEE125 pKa = 4.5AAQSKK130 pKa = 8.08YY131 pKa = 8.0QAVFEE136 pKa = 4.7DD137 pKa = 3.65WFGQYY142 pKa = 10.8YY143 pKa = 10.32SDD145 pKa = 4.64EE146 pKa = 4.29EE147 pKa = 4.2
Molecular weight: 17.02 kDa
Isoelectric point according different methods:
Protein with the highest isoelectric point:
>tr|A0A0B8T0Q4|A0A0B8T0Q4_9SPHI t(6)A37 threonylcarbamoyladenosine biosynthesis protein TsaE OS=Sphingobacterium deserti OX=1229276 GN=DI53_2092 PE=3 SV=1
MM1 pKa = 8.11DD2 pKa = 5.82SICVRR7 pKa = 11.84FVHH10 pKa = 5.86RR11 pKa = 11.84TSLPSFARR19 pKa = 11.84TGRR22 pKa = 11.84YY23 pKa = 6.91FWRR26 pKa = 11.84AKK28 pKa = 7.27VTKK31 pKa = 9.1TPSLEE36 pKa = 4.16TFAGRR41 pKa = 11.84ACAEE45 pKa = 3.68ASFYY49 pKa = 10.54ISQSFRR55 pKa = 11.84GDD57 pKa = 2.6ISFNNGPCNHH67 pKa = 7.17LSTKK71 pKa = 10.02TFLNTKK77 pKa = 9.36YY78 pKa = 10.96YY79 pKa = 11.07NLFSLRR85 pKa = 11.84TTNRR89 pKa = 11.84ANDD92 pKa = 3.68RR93 pKa = 11.84PDD95 pKa = 3.2LQKK98 pKa = 9.95TINGTFTFHH107 pKa = 6.38QAMEE111 pKa = 4.13KK112 pKa = 10.34RR113 pKa = 11.84SAAVAA118 pKa = 3.55
MM1 pKa = 8.11DD2 pKa = 5.82SICVRR7 pKa = 11.84FVHH10 pKa = 5.86RR11 pKa = 11.84TSLPSFARR19 pKa = 11.84TGRR22 pKa = 11.84YY23 pKa = 6.91FWRR26 pKa = 11.84AKK28 pKa = 7.27VTKK31 pKa = 9.1TPSLEE36 pKa = 4.16TFAGRR41 pKa = 11.84ACAEE45 pKa = 3.68ASFYY49 pKa = 10.54ISQSFRR55 pKa = 11.84GDD57 pKa = 2.6ISFNNGPCNHH67 pKa = 7.17LSTKK71 pKa = 10.02TFLNTKK77 pKa = 9.36YY78 pKa = 10.96YY79 pKa = 11.07NLFSLRR85 pKa = 11.84TTNRR89 pKa = 11.84ANDD92 pKa = 3.68RR93 pKa = 11.84PDD95 pKa = 3.2LQKK98 pKa = 9.95TINGTFTFHH107 pKa = 6.38QAMEE111 pKa = 4.13KK112 pKa = 10.34RR113 pKa = 11.84SAAVAA118 pKa = 3.55
Molecular weight: 13.46 kDa
Isoelectric point according different methods:
Peptides (in silico digests for buttom-up proteomics)
Below you can find in silico digests of the whole proteome with Trypsin, Chymotrypsin, Trypsin+LysC, LysN, ArgC proteases suitable for different mass spec machines.| Try ESI |
 |
|---|
| ChTry ESI |
 |
|---|
| ArgC ESI |
 |
|---|
| LysN ESI |
 |
|---|
| TryLysC ESI |
 |
|---|
| Try MALDI |
 |
|---|
| ChTry MALDI |
 |
|---|
| ArgC MALDI |
 |
|---|
| LysN MALDI |
 |
|---|
| TryLysC MALDI |
 |
|---|
| Try LTQ |
 |
|---|
| ChTry LTQ |
 |
|---|
| ArgC LTQ |
 |
|---|
| LysN LTQ |
 |
|---|
| TryLysC LTQ |
 |
|---|
| Try MSlow |
 |
|---|
| ChTry MSlow |
 |
|---|
| ArgC MSlow |
 |
|---|
| LysN MSlow |
 |
|---|
| TryLysC MSlow |
 |
|---|
| Try MShigh |
 |
|---|
| ChTry MShigh |
 |
|---|
| ArgC MShigh |
 |
|---|
| LysN MShigh |
 |
|---|
| TryLysC MShigh |
 |
|---|
General Statistics
Number of major isoforms |
Number of additional isoforms |
Number of all proteins |
Number of amino acids |
Min. Seq. Length |
Max. Seq. Length |
Avg. Seq. Length |
Avg. Mol. Weight |
|---|---|---|---|---|---|---|---|
0 |
1348934 |
29 |
2269 |
339.9 |
38.2 |
Amino acid frequency
Ala |
Cys |
Asp |
Glu |
Phe |
Gly |
His |
Ile |
Lys |
Leu |
|---|---|---|---|---|---|---|---|---|---|
7.648 ± 0.033 | 0.733 ± 0.01 |
5.619 ± 0.026 | 6.016 ± 0.039 |
4.941 ± 0.027 | 6.753 ± 0.035 |
1.951 ± 0.018 | 6.932 ± 0.036 |
6.334 ± 0.045 | 9.653 ± 0.039 |
Met |
Asn |
Gln |
Pro |
Arg |
Ser |
Thr |
Val |
Trp |
Tyr |
|---|---|---|---|---|---|---|---|---|---|
2.311 ± 0.017 | 5.29 ± 0.036 |
3.616 ± 0.018 | 3.92 ± 0.02 |
4.513 ± 0.025 | 6.489 ± 0.031 |
5.455 ± 0.027 | 6.512 ± 0.029 |
1.214 ± 0.016 | 4.099 ± 0.027 |
Most of the basic statistics you can see at this page can be downloaded from this CSV file
Proteome-pI is available under Creative Commons Attribution-NoDerivs license, for more details see here
| Reference: Kozlowski LP. Proteome-pI 2.0: Proteome Isoelectric Point Database Update. Nucleic Acids Res. 2021, doi: 10.1093/nar/gkab944 | Contact: Lukasz P. Kozlowski |
