Avian gyrovirus 2
Taxonomy: Viruses; Anelloviridae; Gyrovirus; Gyrovirus galga1
Average proteome isoelectric point is 8.1
Get precalculated fractions of proteins

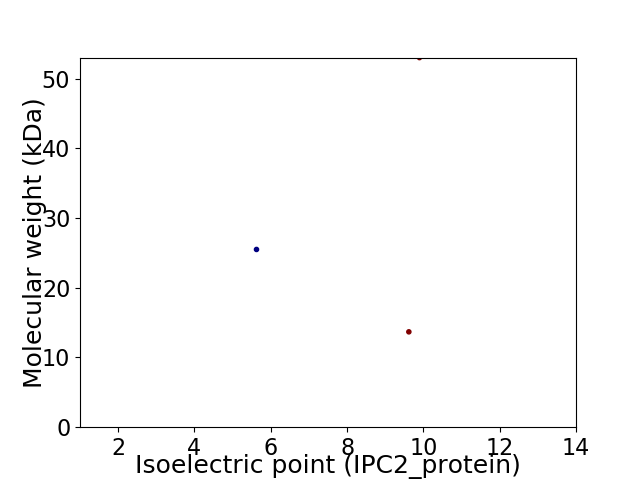
Virtual 2D-PAGE plot for 3 proteins (isoelectric point calculated using IPC2_protein)
Get csv file with sequences according to given criteria:
* You can choose from 21 different methods for calculating isoelectric point
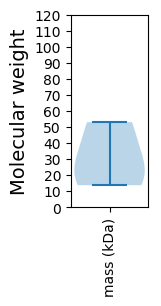
Summary statistics related to proteome-wise predictions


Protein with the lowest isoelectric point:
>tr|F4ZDR1|F4ZDR1_9VIRU Apoptin OS=Avian gyrovirus 2 OX=1002273 PE=3 SV=1
MM1 pKa = 7.59SSGGLGDD8 pKa = 4.8CSACEE13 pKa = 3.67TRR15 pKa = 11.84AAGGSEE21 pKa = 3.92LPLRR25 pKa = 11.84QEE27 pKa = 4.35GQLGPSGAGSTGKK40 pKa = 7.95TLNADD45 pKa = 3.69PPLSPTSNNYY55 pKa = 8.18SVRR58 pKa = 11.84TINGIRR64 pKa = 11.84ASNKK68 pKa = 8.95FVSASRR74 pKa = 11.84NDD76 pKa = 3.88LDD78 pKa = 5.91RR79 pKa = 11.84DD80 pKa = 4.07PNWYY84 pKa = 9.29RR85 pKa = 11.84VNYY88 pKa = 9.29NYY90 pKa = 10.68SIATWLRR97 pKa = 11.84QCARR101 pKa = 11.84SHH103 pKa = 7.67DD104 pKa = 4.46EE105 pKa = 3.53ICTCGRR111 pKa = 11.84WRR113 pKa = 11.84SHH115 pKa = 5.33WFQEE119 pKa = 3.82ASGLVTQEE127 pKa = 3.95TQTDD131 pKa = 3.54QLARR135 pKa = 11.84DD136 pKa = 3.72LRR138 pKa = 11.84RR139 pKa = 11.84LQRR142 pKa = 11.84KK143 pKa = 9.41GEE145 pKa = 3.89AAKK148 pKa = 10.59RR149 pKa = 11.84KK150 pKa = 9.51LDD152 pKa = 3.5YY153 pKa = 10.64LKK155 pKa = 10.87RR156 pKa = 11.84RR157 pKa = 11.84GTPHH161 pKa = 7.49KK162 pKa = 9.42KK163 pKa = 8.53TKK165 pKa = 9.22TVTWQDD171 pKa = 3.18YY172 pKa = 11.46DD173 pKa = 5.45DD174 pKa = 6.12DD175 pKa = 5.46DD176 pKa = 5.81LVDD179 pKa = 4.52ALASTTEE186 pKa = 4.14DD187 pKa = 4.28DD188 pKa = 3.91GTGDD192 pKa = 3.6TDD194 pKa = 4.13CDD196 pKa = 3.21EE197 pKa = 4.65DD198 pKa = 5.2AIPGGVNFDD207 pKa = 3.83MRR209 pKa = 11.84VEE211 pKa = 4.51DD212 pKa = 4.34PLIAALRR219 pKa = 11.84GGSSTHH225 pKa = 5.48TRR227 pKa = 11.84APMWW231 pKa = 4.0
MM1 pKa = 7.59SSGGLGDD8 pKa = 4.8CSACEE13 pKa = 3.67TRR15 pKa = 11.84AAGGSEE21 pKa = 3.92LPLRR25 pKa = 11.84QEE27 pKa = 4.35GQLGPSGAGSTGKK40 pKa = 7.95TLNADD45 pKa = 3.69PPLSPTSNNYY55 pKa = 8.18SVRR58 pKa = 11.84TINGIRR64 pKa = 11.84ASNKK68 pKa = 8.95FVSASRR74 pKa = 11.84NDD76 pKa = 3.88LDD78 pKa = 5.91RR79 pKa = 11.84DD80 pKa = 4.07PNWYY84 pKa = 9.29RR85 pKa = 11.84VNYY88 pKa = 9.29NYY90 pKa = 10.68SIATWLRR97 pKa = 11.84QCARR101 pKa = 11.84SHH103 pKa = 7.67DD104 pKa = 4.46EE105 pKa = 3.53ICTCGRR111 pKa = 11.84WRR113 pKa = 11.84SHH115 pKa = 5.33WFQEE119 pKa = 3.82ASGLVTQEE127 pKa = 3.95TQTDD131 pKa = 3.54QLARR135 pKa = 11.84DD136 pKa = 3.72LRR138 pKa = 11.84RR139 pKa = 11.84LQRR142 pKa = 11.84KK143 pKa = 9.41GEE145 pKa = 3.89AAKK148 pKa = 10.59RR149 pKa = 11.84KK150 pKa = 9.51LDD152 pKa = 3.5YY153 pKa = 10.64LKK155 pKa = 10.87RR156 pKa = 11.84RR157 pKa = 11.84GTPHH161 pKa = 7.49KK162 pKa = 9.42KK163 pKa = 8.53TKK165 pKa = 9.22TVTWQDD171 pKa = 3.18YY172 pKa = 11.46DD173 pKa = 5.45DD174 pKa = 6.12DD175 pKa = 5.46DD176 pKa = 5.81LVDD179 pKa = 4.52ALASTTEE186 pKa = 4.14DD187 pKa = 4.28DD188 pKa = 3.91GTGDD192 pKa = 3.6TDD194 pKa = 4.13CDD196 pKa = 3.21EE197 pKa = 4.65DD198 pKa = 5.2AIPGGVNFDD207 pKa = 3.83MRR209 pKa = 11.84VEE211 pKa = 4.51DD212 pKa = 4.34PLIAALRR219 pKa = 11.84GGSSTHH225 pKa = 5.48TRR227 pKa = 11.84APMWW231 pKa = 4.0
Molecular weight: 25.49 kDa
Isoelectric point according different methods:
Protein with the highest isoelectric point:
>tr|F4ZDR2|F4ZDR2_9VIRU CA1 OS=Avian gyrovirus 2 OX=1002273 GN=VP1 PE=3 SV=1
MM1 pKa = 6.13QTPRR5 pKa = 11.84SRR7 pKa = 11.84RR8 pKa = 11.84QATTTRR14 pKa = 11.84SEE16 pKa = 3.99LLTAYY21 pKa = 7.49EE22 pKa = 5.27HH23 pKa = 6.65PTSSCPPAEE32 pKa = 4.21TTSIEE37 pKa = 3.89IQIGIGSTIITLSLPGYY54 pKa = 9.93ASVRR58 pKa = 11.84VLTTRR63 pKa = 11.84SAPADD68 pKa = 3.91DD69 pKa = 4.62GGVTGSRR76 pKa = 11.84RR77 pKa = 11.84LADD80 pKa = 3.39SSHH83 pKa = 5.87RR84 pKa = 11.84RR85 pKa = 11.84PRR87 pKa = 11.84RR88 pKa = 11.84TSSPEE93 pKa = 3.4IYY95 pKa = 10.42VGFSAKK101 pKa = 8.49EE102 pKa = 3.68RR103 pKa = 11.84RR104 pKa = 11.84QKK106 pKa = 11.19EE107 pKa = 3.7NLITLRR113 pKa = 11.84EE114 pKa = 4.1EE115 pKa = 4.39GPPIKK120 pKa = 10.26KK121 pKa = 9.87LRR123 pKa = 11.84LL124 pKa = 3.44
MM1 pKa = 6.13QTPRR5 pKa = 11.84SRR7 pKa = 11.84RR8 pKa = 11.84QATTTRR14 pKa = 11.84SEE16 pKa = 3.99LLTAYY21 pKa = 7.49EE22 pKa = 5.27HH23 pKa = 6.65PTSSCPPAEE32 pKa = 4.21TTSIEE37 pKa = 3.89IQIGIGSTIITLSLPGYY54 pKa = 9.93ASVRR58 pKa = 11.84VLTTRR63 pKa = 11.84SAPADD68 pKa = 3.91DD69 pKa = 4.62GGVTGSRR76 pKa = 11.84RR77 pKa = 11.84LADD80 pKa = 3.39SSHH83 pKa = 5.87RR84 pKa = 11.84RR85 pKa = 11.84PRR87 pKa = 11.84RR88 pKa = 11.84TSSPEE93 pKa = 3.4IYY95 pKa = 10.42VGFSAKK101 pKa = 8.49EE102 pKa = 3.68RR103 pKa = 11.84RR104 pKa = 11.84QKK106 pKa = 11.19EE107 pKa = 3.7NLITLRR113 pKa = 11.84EE114 pKa = 4.1EE115 pKa = 4.39GPPIKK120 pKa = 10.26KK121 pKa = 9.87LRR123 pKa = 11.84LL124 pKa = 3.44
Molecular weight: 13.67 kDa
Isoelectric point according different methods:
Peptides (in silico digests for buttom-up proteomics)
Below you can find in silico digests of the whole proteome with Trypsin, Chymotrypsin, Trypsin+LysC, LysN, ArgC proteases suitable for different mass spec machines.| Try ESI |
 |
|---|
| ChTry ESI |
 |
|---|
| ArgC ESI |
 |
|---|
| LysN ESI |
 |
|---|
| TryLysC ESI |
 |
|---|
| Try MALDI |
 |
|---|
| ChTry MALDI |
 |
|---|
| ArgC MALDI |
 |
|---|
| LysN MALDI |
 |
|---|
| TryLysC MALDI |
 |
|---|
| Try LTQ |
 |
|---|
| ChTry LTQ |
 |
|---|
| ArgC LTQ |
 |
|---|
| LysN LTQ |
 |
|---|
| TryLysC LTQ |
 |
|---|
| Try MSlow |
 |
|---|
| ChTry MSlow |
 |
|---|
| ArgC MSlow |
 |
|---|
| LysN MSlow |
 |
|---|
| TryLysC MSlow |
 |
|---|
| Try MShigh |
 |
|---|
| ChTry MShigh |
 |
|---|
| ArgC MShigh |
 |
|---|
| LysN MShigh |
 |
|---|
| TryLysC MShigh |
 |
|---|
General Statistics
Number of major isoforms |
Number of additional isoforms |
Number of all proteins |
Number of amino acids |
Min. Seq. Length |
Max. Seq. Length |
Avg. Seq. Length |
Avg. Mol. Weight |
|---|---|---|---|---|---|---|---|
0 |
815 |
124 |
460 |
271.7 |
30.72 |
Amino acid frequency
Ala |
Cys |
Asp |
Glu |
Phe |
Gly |
His |
Ile |
Lys |
Leu |
|---|---|---|---|---|---|---|---|---|---|
7.607 ± 0.345 | 1.718 ± 0.374 |
5.031 ± 1.964 | 3.558 ± 1.243 |
3.313 ± 1.321 | 7.607 ± 0.601 |
2.209 ± 0.313 | 3.313 ± 1.082 |
3.926 ± 0.21 | 7.239 ± 0.395 |
Met |
Asn |
Gln |
Pro |
Arg |
Ser |
Thr |
Val |
Trp |
Tyr |
|---|---|---|---|---|---|---|---|---|---|
2.331 ± 0.734 | 3.681 ± 0.785 |
7.485 ± 1.299 | 5.031 ± 0.839 |
9.939 ± 0.81 | 7.362 ± 1.56 |
7.853 ± 1.406 | 4.54 ± 0.7 |
2.945 ± 0.927 | 3.313 ± 0.47 |
Most of the basic statistics you can see at this page can be downloaded from this CSV file
Proteome-pI is available under Creative Commons Attribution-NoDerivs license, for more details see here
| Reference: Kozlowski LP. Proteome-pI 2.0: Proteome Isoelectric Point Database Update. Nucleic Acids Res. 2021, doi: 10.1093/nar/gkab944 | Contact: Lukasz P. Kozlowski |
