Borna disease virus (strain V) (BDV)
Taxonomy: Viruses; Riboviria; Orthornavirae; Negarnaviricota; Haploviricotina; Monjiviricetes; Mononegavirales; Bornaviridae; unclassified Bornaviridae; Borna disease virus
Average proteome isoelectric point is 6.68
Get precalculated fractions of proteins

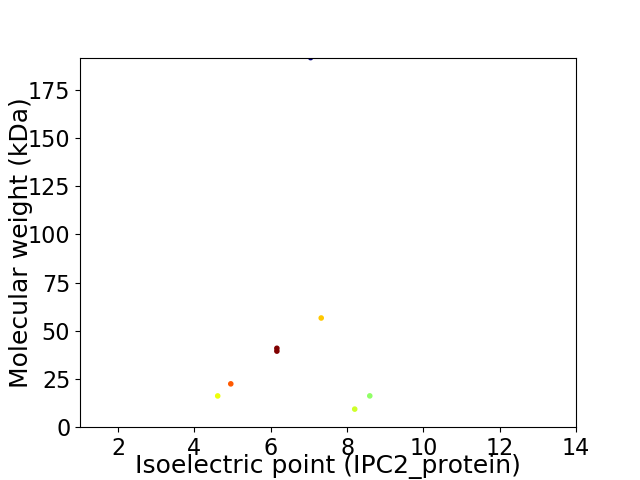
Virtual 2D-PAGE plot for 8 proteins (isoelectric point calculated using IPC2_protein)
Get csv file with sequences according to given criteria:
* You can choose from 21 different methods for calculating isoelectric point
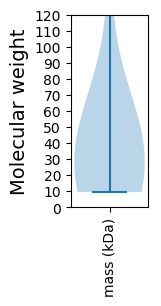
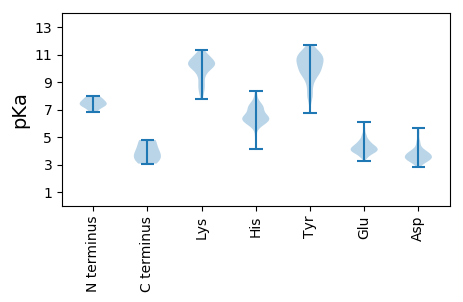
Summary statistics related to proteome-wise predictions


Protein with the lowest isoelectric point:
>sp|P0C799-2|PHOSP-2_BDVV Isoform of P0C799 Isoform p16 of Phosphoprotein OS=Borna disease virus (strain V) OX=928296 GN=P/X PE=1 SV=1
MM1 pKa = 7.76ISDD4 pKa = 4.12PDD6 pKa = 3.4QRR8 pKa = 11.84TGRR11 pKa = 11.84EE12 pKa = 3.69QLSNDD17 pKa = 3.48EE18 pKa = 4.78LIKK21 pKa = 11.06KK22 pKa = 9.74LVTEE26 pKa = 4.26LAEE29 pKa = 3.91NSMIEE34 pKa = 4.03AEE36 pKa = 4.42EE37 pKa = 4.07VRR39 pKa = 11.84GTLGDD44 pKa = 3.36ISARR48 pKa = 11.84IEE50 pKa = 3.93AGFEE54 pKa = 4.21SLSALQVEE62 pKa = 5.61TIQTAQRR69 pKa = 11.84CDD71 pKa = 3.27HH72 pKa = 6.83SDD74 pKa = 3.55SIRR77 pKa = 11.84ILGEE81 pKa = 3.61NIKK84 pKa = 10.55ILDD87 pKa = 3.75RR88 pKa = 11.84SMKK91 pKa = 10.56TMMEE95 pKa = 4.08TMKK98 pKa = 11.31LMMEE102 pKa = 4.38KK103 pKa = 10.34VDD105 pKa = 4.56LLYY108 pKa = 11.09ASTAVGTSAPMLPSHH123 pKa = 7.28PAPPRR128 pKa = 11.84IYY130 pKa = 9.39PQLPSAPTTDD140 pKa = 3.14EE141 pKa = 3.5WDD143 pKa = 3.86IIPP146 pKa = 4.79
MM1 pKa = 7.76ISDD4 pKa = 4.12PDD6 pKa = 3.4QRR8 pKa = 11.84TGRR11 pKa = 11.84EE12 pKa = 3.69QLSNDD17 pKa = 3.48EE18 pKa = 4.78LIKK21 pKa = 11.06KK22 pKa = 9.74LVTEE26 pKa = 4.26LAEE29 pKa = 3.91NSMIEE34 pKa = 4.03AEE36 pKa = 4.42EE37 pKa = 4.07VRR39 pKa = 11.84GTLGDD44 pKa = 3.36ISARR48 pKa = 11.84IEE50 pKa = 3.93AGFEE54 pKa = 4.21SLSALQVEE62 pKa = 5.61TIQTAQRR69 pKa = 11.84CDD71 pKa = 3.27HH72 pKa = 6.83SDD74 pKa = 3.55SIRR77 pKa = 11.84ILGEE81 pKa = 3.61NIKK84 pKa = 10.55ILDD87 pKa = 3.75RR88 pKa = 11.84SMKK91 pKa = 10.56TMMEE95 pKa = 4.08TMKK98 pKa = 11.31LMMEE102 pKa = 4.38KK103 pKa = 10.34VDD105 pKa = 4.56LLYY108 pKa = 11.09ASTAVGTSAPMLPSHH123 pKa = 7.28PAPPRR128 pKa = 11.84IYY130 pKa = 9.39PQLPSAPTTDD140 pKa = 3.14EE141 pKa = 3.5WDD143 pKa = 3.86IIPP146 pKa = 4.79
Molecular weight: 16.21 kDa
Isoelectric point according different methods:
Protein with the highest isoelectric point:
>sp|P0C797|NCAP_BDVV Nucleoprotein OS=Borna disease virus (strain V) OX=928296 GN=N PE=1 SV=1
MM1 pKa = 7.3NSKK4 pKa = 10.31HH5 pKa = 6.92SYY7 pKa = 10.83VEE9 pKa = 4.3LKK11 pKa = 10.9DD12 pKa = 3.76KK13 pKa = 11.1VIVPGWPTLMLEE25 pKa = 3.83IDD27 pKa = 4.11FVGGTSRR34 pKa = 11.84NQFLNIPFLSVKK46 pKa = 10.28EE47 pKa = 3.94PLQLPRR53 pKa = 11.84EE54 pKa = 4.28KK55 pKa = 10.81KK56 pKa = 8.75LTDD59 pKa = 3.37YY60 pKa = 8.76FTIDD64 pKa = 3.51VEE66 pKa = 4.47PAGHH70 pKa = 6.21SLVNIYY76 pKa = 9.79FQIDD80 pKa = 3.82DD81 pKa = 4.34FLLLTLNSLSVYY93 pKa = 10.08KK94 pKa = 10.8DD95 pKa = 3.79PIRR98 pKa = 11.84KK99 pKa = 9.45YY100 pKa = 10.2MFLRR104 pKa = 11.84LNKK107 pKa = 9.78DD108 pKa = 3.36QSKK111 pKa = 9.99HH112 pKa = 5.94AINAAFNVFSYY123 pKa = 10.67RR124 pKa = 11.84LRR126 pKa = 11.84NIGVGPLGPDD136 pKa = 3.05IRR138 pKa = 11.84SSGPP142 pKa = 3.07
MM1 pKa = 7.3NSKK4 pKa = 10.31HH5 pKa = 6.92SYY7 pKa = 10.83VEE9 pKa = 4.3LKK11 pKa = 10.9DD12 pKa = 3.76KK13 pKa = 11.1VIVPGWPTLMLEE25 pKa = 3.83IDD27 pKa = 4.11FVGGTSRR34 pKa = 11.84NQFLNIPFLSVKK46 pKa = 10.28EE47 pKa = 3.94PLQLPRR53 pKa = 11.84EE54 pKa = 4.28KK55 pKa = 10.81KK56 pKa = 8.75LTDD59 pKa = 3.37YY60 pKa = 8.76FTIDD64 pKa = 3.51VEE66 pKa = 4.47PAGHH70 pKa = 6.21SLVNIYY76 pKa = 9.79FQIDD80 pKa = 3.82DD81 pKa = 4.34FLLLTLNSLSVYY93 pKa = 10.08KK94 pKa = 10.8DD95 pKa = 3.79PIRR98 pKa = 11.84KK99 pKa = 9.45YY100 pKa = 10.2MFLRR104 pKa = 11.84LNKK107 pKa = 9.78DD108 pKa = 3.36QSKK111 pKa = 9.99HH112 pKa = 5.94AINAAFNVFSYY123 pKa = 10.67RR124 pKa = 11.84LRR126 pKa = 11.84NIGVGPLGPDD136 pKa = 3.05IRR138 pKa = 11.84SSGPP142 pKa = 3.07
Molecular weight: 16.24 kDa
Isoelectric point according different methods:
Peptides (in silico digests for buttom-up proteomics)
Below you can find in silico digests of the whole proteome with Trypsin, Chymotrypsin, Trypsin+LysC, LysN, ArgC proteases suitable for different mass spec machines.| Try ESI |
 |
|---|
| ChTry ESI |
 |
|---|
| ArgC ESI |
 |
|---|
| LysN ESI |
 |
|---|
| TryLysC ESI |
 |
|---|
| Try MALDI |
 |
|---|
| ChTry MALDI |
 |
|---|
| ArgC MALDI |
 |
|---|
| LysN MALDI |
 |
|---|
| TryLysC MALDI |
 |
|---|
| Try LTQ |
 |
|---|
| ChTry LTQ |
 |
|---|
| ArgC LTQ |
 |
|---|
| LysN LTQ |
 |
|---|
| TryLysC LTQ |
 |
|---|
| Try MSlow |
 |
|---|
| ChTry MSlow |
 |
|---|
| ArgC MSlow |
 |
|---|
| LysN MSlow |
 |
|---|
| TryLysC MSlow |
 |
|---|
| Try MShigh |
 |
|---|
| ChTry MShigh |
 |
|---|
| ArgC MShigh |
 |
|---|
| LysN MShigh |
 |
|---|
| TryLysC MShigh |
 |
|---|
General Statistics
Number of major isoforms |
Number of additional isoforms |
Number of all proteins |
Number of amino acids |
Min. Seq. Length |
Max. Seq. Length |
Avg. Seq. Length |
Avg. Mol. Weight |
|---|---|---|---|---|---|---|---|
3517 |
87 |
1711 |
439.6 |
49.14 |
Amino acid frequency
Ala |
Cys |
Asp |
Glu |
Phe |
Gly |
His |
Ile |
Lys |
Leu |
|---|---|---|---|---|---|---|---|---|---|
6.995 ± 0.565 | 2.019 ± 0.496 |
5.061 ± 0.351 | 5.601 ± 0.719 |
3.782 ± 0.495 | 5.886 ± 0.397 |
2.388 ± 0.2 | 6.028 ± 0.267 |
4.35 ± 0.511 | 11.373 ± 0.808 |
Met |
Asn |
Gln |
Pro |
Arg |
Ser |
Thr |
Val |
Trp |
Tyr |
|---|---|---|---|---|---|---|---|---|---|
2.559 ± 0.488 | 2.985 ± 0.495 |
5.857 ± 0.561 | 3.583 ± 0.169 |
6.113 ± 0.366 | 8.274 ± 0.37 |
6.369 ± 0.647 | 6.17 ± 0.626 |
1.279 ± 0.257 | 3.327 ± 0.434 |
Most of the basic statistics you can see at this page can be downloaded from this CSV file
Proteome-pI is available under Creative Commons Attribution-NoDerivs license, for more details see here
| Reference: Kozlowski LP. Proteome-pI 2.0: Proteome Isoelectric Point Database Update. Nucleic Acids Res. 2021, doi: 10.1093/nar/gkab944 | Contact: Lukasz P. Kozlowski |
