Pseudonocardia dioxanivorans (strain ATCC 55486 / DSM 44775 / JCM 13855 / CB1190)
Taxonomy: cellular organisms; Bacteria; Terrabacteria group; Actinobacteria; Actinomycetia; Pseudonocardiales; Pseudonocardiaceae; Pseudonocardia; Pseudonocardia dioxanivorans
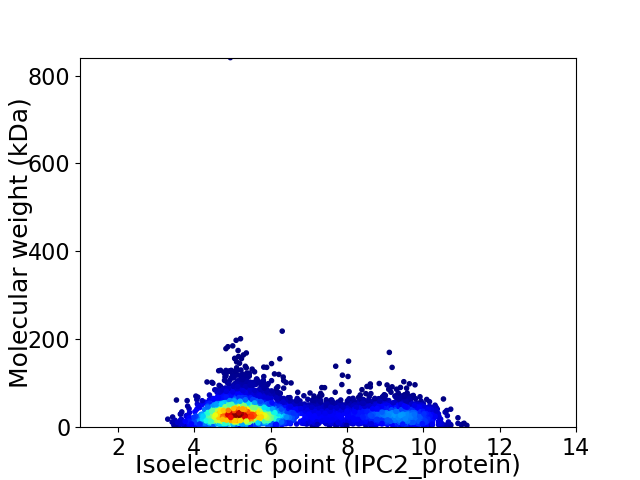
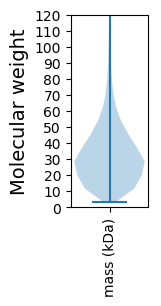
Average proteome isoelectric point is 6.21
Get precalculated fractions of proteins

Virtual 2D-PAGE plot for 6620 proteins (isoelectric point calculated using IPC2_protein)
Get csv file with sequences according to given criteria:
* You can choose from 21 different methods for calculating isoelectric point
Summary statistics related to proteome-wise predictions


Protein with the lowest isoelectric point:
>tr|F4CPW4|F4CPW4_PSEUX GCN5-related N-acetyltransferase OS=Pseudonocardia dioxanivorans (strain ATCC 55486 / DSM 44775 / JCM 13855 / CB1190) OX=675635 GN=Psed_3981 PE=4 SV=1
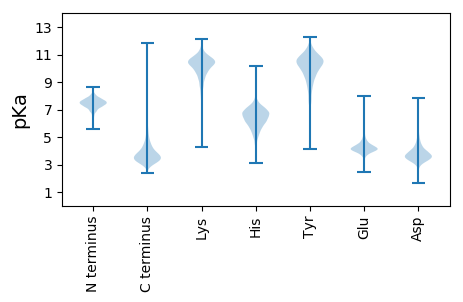
MM1 pKa = 7.27ATHH4 pKa = 6.86EE5 pKa = 4.6GQWKK9 pKa = 10.26AGTPCWVDD17 pKa = 3.65LNVPDD22 pKa = 4.82VPTATAFYY30 pKa = 10.26SAVLGWSFVDD40 pKa = 3.83TGAEE44 pKa = 3.78FGNYY48 pKa = 9.33QIAQVDD54 pKa = 3.67GRR56 pKa = 11.84AAAGIGPIMQEE67 pKa = 4.12GQPSFWTLYY76 pKa = 10.09LASDD80 pKa = 4.63DD81 pKa = 4.47ADD83 pKa = 3.46ATAKK87 pKa = 10.62LVTDD91 pKa = 3.91NGGSLIAGPMDD102 pKa = 3.24IPGSGRR108 pKa = 11.84MVIATDD114 pKa = 3.11TAGAVFGVWQTLGMNGAEE132 pKa = 4.24VVNEE136 pKa = 3.86PGGLVWEE143 pKa = 4.99DD144 pKa = 3.44ARR146 pKa = 11.84LTDD149 pKa = 4.31PEE151 pKa = 4.24TARR154 pKa = 11.84AFYY157 pKa = 10.44AAVFGYY163 pKa = 9.17TYY165 pKa = 10.68DD166 pKa = 3.81AVDD169 pKa = 4.66GAPEE173 pKa = 5.01DD174 pKa = 4.0YY175 pKa = 7.89TTFALDD181 pKa = 3.66GEE183 pKa = 4.93IKK185 pKa = 10.68GGMGGLMGAPDD196 pKa = 4.45GTPSHH201 pKa = 7.08WIAYY205 pKa = 9.16FGAADD210 pKa = 3.35VDD212 pKa = 3.89AAVAQVQANGGSVMMAPQNTPFGRR236 pKa = 11.84MGIVADD242 pKa = 3.77PFGAPFCLHH251 pKa = 6.61GEE253 pKa = 4.36VTGG256 pKa = 3.99
MM1 pKa = 7.27ATHH4 pKa = 6.86EE5 pKa = 4.6GQWKK9 pKa = 10.26AGTPCWVDD17 pKa = 3.65LNVPDD22 pKa = 4.82VPTATAFYY30 pKa = 10.26SAVLGWSFVDD40 pKa = 3.83TGAEE44 pKa = 3.78FGNYY48 pKa = 9.33QIAQVDD54 pKa = 3.67GRR56 pKa = 11.84AAAGIGPIMQEE67 pKa = 4.12GQPSFWTLYY76 pKa = 10.09LASDD80 pKa = 4.63DD81 pKa = 4.47ADD83 pKa = 3.46ATAKK87 pKa = 10.62LVTDD91 pKa = 3.91NGGSLIAGPMDD102 pKa = 3.24IPGSGRR108 pKa = 11.84MVIATDD114 pKa = 3.11TAGAVFGVWQTLGMNGAEE132 pKa = 4.24VVNEE136 pKa = 3.86PGGLVWEE143 pKa = 4.99DD144 pKa = 3.44ARR146 pKa = 11.84LTDD149 pKa = 4.31PEE151 pKa = 4.24TARR154 pKa = 11.84AFYY157 pKa = 10.44AAVFGYY163 pKa = 9.17TYY165 pKa = 10.68DD166 pKa = 3.81AVDD169 pKa = 4.66GAPEE173 pKa = 5.01DD174 pKa = 4.0YY175 pKa = 7.89TTFALDD181 pKa = 3.66GEE183 pKa = 4.93IKK185 pKa = 10.68GGMGGLMGAPDD196 pKa = 4.45GTPSHH201 pKa = 7.08WIAYY205 pKa = 9.16FGAADD210 pKa = 3.35VDD212 pKa = 3.89AAVAQVQANGGSVMMAPQNTPFGRR236 pKa = 11.84MGIVADD242 pKa = 3.77PFGAPFCLHH251 pKa = 6.61GEE253 pKa = 4.36VTGG256 pKa = 3.99
Molecular weight: 26.47 kDa
Isoelectric point according different methods:
Protein with the highest isoelectric point:
>tr|F4CZY9|F4CZY9_PSEUX O-succinylbenzoate--CoA ligase OS=Pseudonocardia dioxanivorans (strain ATCC 55486 / DSM 44775 / JCM 13855 / CB1190) OX=675635 GN=Psed_2619 PE=4 SV=1
MM1 pKa = 7.4GSVIKK6 pKa = 10.38KK7 pKa = 8.42RR8 pKa = 11.84RR9 pKa = 11.84KK10 pKa = 9.06RR11 pKa = 11.84MSKK14 pKa = 9.76KK15 pKa = 9.54KK16 pKa = 9.79HH17 pKa = 5.67RR18 pKa = 11.84KK19 pKa = 8.46LLRR22 pKa = 11.84KK23 pKa = 7.95TRR25 pKa = 11.84VQRR28 pKa = 11.84RR29 pKa = 11.84KK30 pKa = 10.07LGKK33 pKa = 9.87
MM1 pKa = 7.4GSVIKK6 pKa = 10.38KK7 pKa = 8.42RR8 pKa = 11.84RR9 pKa = 11.84KK10 pKa = 9.06RR11 pKa = 11.84MSKK14 pKa = 9.76KK15 pKa = 9.54KK16 pKa = 9.79HH17 pKa = 5.67RR18 pKa = 11.84KK19 pKa = 8.46LLRR22 pKa = 11.84KK23 pKa = 7.95TRR25 pKa = 11.84VQRR28 pKa = 11.84RR29 pKa = 11.84KK30 pKa = 10.07LGKK33 pKa = 9.87
Molecular weight: 4.12 kDa
Isoelectric point according different methods:
Peptides (in silico digests for buttom-up proteomics)
Below you can find in silico digests of the whole proteome with Trypsin, Chymotrypsin, Trypsin+LysC, LysN, ArgC proteases suitable for different mass spec machines.| Try ESI |
 |
|---|
| ChTry ESI |
 |
|---|
| ArgC ESI |
 |
|---|
| LysN ESI |
 |
|---|
| TryLysC ESI |
 |
|---|
| Try MALDI |
 |
|---|
| ChTry MALDI |
 |
|---|
| ArgC MALDI |
 |
|---|
| LysN MALDI |
 |
|---|
| TryLysC MALDI |
 |
|---|
| Try LTQ |
 |
|---|
| ChTry LTQ |
 |
|---|
| ArgC LTQ |
 |
|---|
| LysN LTQ |
 |
|---|
| TryLysC LTQ |
 |
|---|
| Try MSlow |
 |
|---|
| ChTry MSlow |
 |
|---|
| ArgC MSlow |
 |
|---|
| LysN MSlow |
 |
|---|
| TryLysC MSlow |
 |
|---|
| Try MShigh |
 |
|---|
| ChTry MShigh |
 |
|---|
| ArgC MShigh |
 |
|---|
| LysN MShigh |
 |
|---|
| TryLysC MShigh |
 |
|---|
General Statistics
Number of major isoforms |
Number of additional isoforms |
Number of all proteins |
Number of amino acids |
Min. Seq. Length |
Max. Seq. Length |
Avg. Seq. Length |
Avg. Mol. Weight |
|---|---|---|---|---|---|---|---|
0 |
2118731 |
30 |
7912 |
320.1 |
33.97 |
Amino acid frequency
Ala |
Cys |
Asp |
Glu |
Phe |
Gly |
His |
Ile |
Lys |
Leu |
|---|---|---|---|---|---|---|---|---|---|
14.487 ± 0.046 | 0.774 ± 0.009 |
6.447 ± 0.027 | 5.231 ± 0.03 |
2.6 ± 0.017 | 9.639 ± 0.031 |
2.209 ± 0.015 | 3.128 ± 0.021 |
1.417 ± 0.015 | 10.153 ± 0.034 |
Met |
Asn |
Gln |
Pro |
Arg |
Ser |
Thr |
Val |
Trp |
Tyr |
|---|---|---|---|---|---|---|---|---|---|
1.685 ± 0.012 | 1.513 ± 0.014 |
6.321 ± 0.028 | 2.408 ± 0.018 |
8.439 ± 0.033 | 4.718 ± 0.022 |
6.025 ± 0.022 | 9.601 ± 0.032 |
1.439 ± 0.013 | 1.767 ± 0.014 |
Most of the basic statistics you can see at this page can be downloaded from this CSV file
Proteome-pI is available under Creative Commons Attribution-NoDerivs license, for more details see here
| Reference: Kozlowski LP. Proteome-pI 2.0: Proteome Isoelectric Point Database Update. Nucleic Acids Res. 2021, doi: 10.1093/nar/gkab944 | Contact: Lukasz P. Kozlowski |
