Leucobacter chromiiresistens
Taxonomy: cellular organisms; Bacteria; Terrabacteria group; Actinobacteria; Actinomycetia; Micrococcales; Microbacteriaceae; Leucobacter
Average proteome isoelectric point is 6.06
Get precalculated fractions of proteins

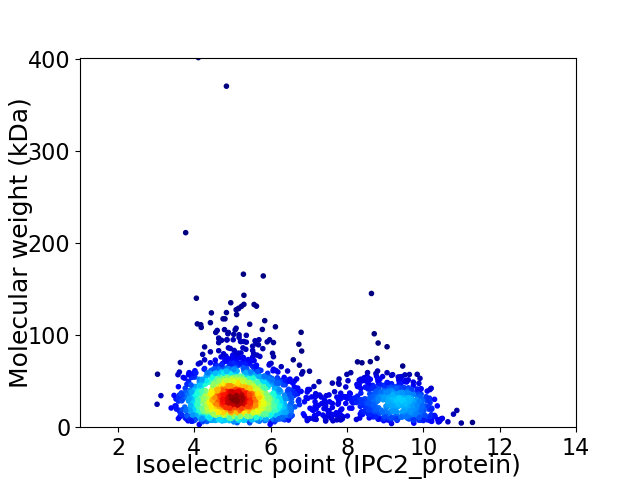
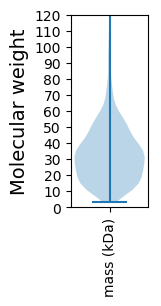
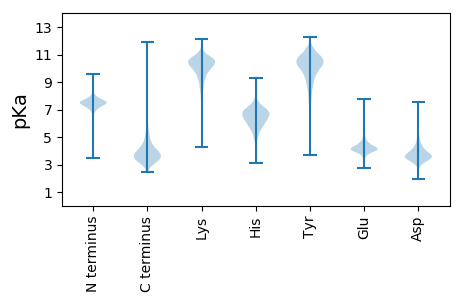
Virtual 2D-PAGE plot for 2423 proteins (isoelectric point calculated using IPC2_protein)
Get csv file with sequences according to given criteria:
* You can choose from 21 different methods for calculating isoelectric point
Summary statistics related to proteome-wise predictions


Protein with the lowest isoelectric point:
>tr|A0A147ERP8|A0A147ERP8_9MICO Inner-membrane translocator OS=Leucobacter chromiiresistens OX=1079994 GN=NS354_01550 PE=4 SV=1
AA1 pKa = 7.62AAQAVFDD8 pKa = 4.62RR9 pKa = 11.84VNADD13 pKa = 2.98GGIDD17 pKa = 3.6GRR19 pKa = 11.84QIEE22 pKa = 4.89YY23 pKa = 8.1TTVDD27 pKa = 3.93DD28 pKa = 5.25KK29 pKa = 11.91GDD31 pKa = 3.93PASATAAARR40 pKa = 11.84QLVGSDD46 pKa = 3.24EE47 pKa = 4.38VVALVGGASLIEE59 pKa = 4.09CEE61 pKa = 4.66INQEE65 pKa = 4.1YY66 pKa = 9.34YY67 pKa = 10.44AQEE70 pKa = 4.26NVLSMPGIGVDD81 pKa = 3.66TGCFDD86 pKa = 4.21SPNIAPANLGPFNDD100 pKa = 3.7MTLTLLNGSEE110 pKa = 4.17NLGLDD115 pKa = 4.57DD116 pKa = 4.09ICVLLEE122 pKa = 3.83IAGSTKK128 pKa = 9.4PAYY131 pKa = 10.17LAGVEE136 pKa = 4.09KK137 pKa = 8.66WTEE140 pKa = 3.72ITGEE144 pKa = 4.12EE145 pKa = 4.41PLLVDD150 pKa = 5.28DD151 pKa = 4.65SLPYY155 pKa = 10.49GGSDD159 pKa = 3.23YY160 pKa = 11.14TPYY163 pKa = 10.17IVKK166 pKa = 10.28AKK168 pKa = 10.48NAGCSAIAVNGIEE181 pKa = 4.51PDD183 pKa = 3.82AIGQVKK189 pKa = 9.47AAQAQGWDD197 pKa = 3.32DD198 pKa = 3.54VTFLFLTSVYY208 pKa = 10.7SEE210 pKa = 4.39NFASALDD217 pKa = 3.5WTGAGVHH224 pKa = 5.68VPAEE228 pKa = 4.43FYY230 pKa = 10.62PFTEE234 pKa = 4.6DD235 pKa = 4.48NEE237 pKa = 4.43INADD241 pKa = 3.28WKK243 pKa = 11.41SLMEE247 pKa = 4.66EE248 pKa = 3.68NDD250 pKa = 3.1IALTSFSQGGYY261 pKa = 9.66LAATHH266 pKa = 5.91LVEE269 pKa = 4.56VLSGMEE275 pKa = 3.95GEE277 pKa = 4.29ITRR280 pKa = 11.84EE281 pKa = 3.87TVAEE285 pKa = 4.34ALHH288 pKa = 6.71GMDD291 pKa = 5.32PIEE294 pKa = 4.72NPMVAAPYY302 pKa = 10.56QFDD305 pKa = 3.22QVAAQEE311 pKa = 4.19YY312 pKa = 8.57TPGGWPVVLEE322 pKa = 4.21SGTRR326 pKa = 11.84AWKK329 pKa = 10.33QSADD333 pKa = 3.24DD334 pKa = 3.78WLIPSSS340 pKa = 3.62
AA1 pKa = 7.62AAQAVFDD8 pKa = 4.62RR9 pKa = 11.84VNADD13 pKa = 2.98GGIDD17 pKa = 3.6GRR19 pKa = 11.84QIEE22 pKa = 4.89YY23 pKa = 8.1TTVDD27 pKa = 3.93DD28 pKa = 5.25KK29 pKa = 11.91GDD31 pKa = 3.93PASATAAARR40 pKa = 11.84QLVGSDD46 pKa = 3.24EE47 pKa = 4.38VVALVGGASLIEE59 pKa = 4.09CEE61 pKa = 4.66INQEE65 pKa = 4.1YY66 pKa = 9.34YY67 pKa = 10.44AQEE70 pKa = 4.26NVLSMPGIGVDD81 pKa = 3.66TGCFDD86 pKa = 4.21SPNIAPANLGPFNDD100 pKa = 3.7MTLTLLNGSEE110 pKa = 4.17NLGLDD115 pKa = 4.57DD116 pKa = 4.09ICVLLEE122 pKa = 3.83IAGSTKK128 pKa = 9.4PAYY131 pKa = 10.17LAGVEE136 pKa = 4.09KK137 pKa = 8.66WTEE140 pKa = 3.72ITGEE144 pKa = 4.12EE145 pKa = 4.41PLLVDD150 pKa = 5.28DD151 pKa = 4.65SLPYY155 pKa = 10.49GGSDD159 pKa = 3.23YY160 pKa = 11.14TPYY163 pKa = 10.17IVKK166 pKa = 10.28AKK168 pKa = 10.48NAGCSAIAVNGIEE181 pKa = 4.51PDD183 pKa = 3.82AIGQVKK189 pKa = 9.47AAQAQGWDD197 pKa = 3.32DD198 pKa = 3.54VTFLFLTSVYY208 pKa = 10.7SEE210 pKa = 4.39NFASALDD217 pKa = 3.5WTGAGVHH224 pKa = 5.68VPAEE228 pKa = 4.43FYY230 pKa = 10.62PFTEE234 pKa = 4.6DD235 pKa = 4.48NEE237 pKa = 4.43INADD241 pKa = 3.28WKK243 pKa = 11.41SLMEE247 pKa = 4.66EE248 pKa = 3.68NDD250 pKa = 3.1IALTSFSQGGYY261 pKa = 9.66LAATHH266 pKa = 5.91LVEE269 pKa = 4.56VLSGMEE275 pKa = 3.95GEE277 pKa = 4.29ITRR280 pKa = 11.84EE281 pKa = 3.87TVAEE285 pKa = 4.34ALHH288 pKa = 6.71GMDD291 pKa = 5.32PIEE294 pKa = 4.72NPMVAAPYY302 pKa = 10.56QFDD305 pKa = 3.22QVAAQEE311 pKa = 4.19YY312 pKa = 8.57TPGGWPVVLEE322 pKa = 4.21SGTRR326 pKa = 11.84AWKK329 pKa = 10.33QSADD333 pKa = 3.24DD334 pKa = 3.78WLIPSSS340 pKa = 3.62
Molecular weight: 36.1 kDa
Isoelectric point according different methods:
Protein with the highest isoelectric point:
>tr|A0A147ERN6|A0A147ERN6_9MICO Nitrilase OS=Leucobacter chromiiresistens OX=1079994 GN=NS354_00710 PE=4 SV=1
MM1 pKa = 7.69SKK3 pKa = 9.0RR4 pKa = 11.84TFQPNNRR11 pKa = 11.84RR12 pKa = 11.84RR13 pKa = 11.84AKK15 pKa = 9.5VHH17 pKa = 5.46GFRR20 pKa = 11.84ARR22 pKa = 11.84MRR24 pKa = 11.84TRR26 pKa = 11.84AGRR29 pKa = 11.84AIVAARR35 pKa = 11.84RR36 pKa = 11.84GKK38 pKa = 10.45GRR40 pKa = 11.84SKK42 pKa = 10.13LTAA45 pKa = 4.04
MM1 pKa = 7.69SKK3 pKa = 9.0RR4 pKa = 11.84TFQPNNRR11 pKa = 11.84RR12 pKa = 11.84RR13 pKa = 11.84AKK15 pKa = 9.5VHH17 pKa = 5.46GFRR20 pKa = 11.84ARR22 pKa = 11.84MRR24 pKa = 11.84TRR26 pKa = 11.84AGRR29 pKa = 11.84AIVAARR35 pKa = 11.84RR36 pKa = 11.84GKK38 pKa = 10.45GRR40 pKa = 11.84SKK42 pKa = 10.13LTAA45 pKa = 4.04
Molecular weight: 5.18 kDa
Isoelectric point according different methods:
Peptides (in silico digests for buttom-up proteomics)
Below you can find in silico digests of the whole proteome with Trypsin, Chymotrypsin, Trypsin+LysC, LysN, ArgC proteases suitable for different mass spec machines.| Try ESI |
 |
|---|
| ChTry ESI |
 |
|---|
| ArgC ESI |
 |
|---|
| LysN ESI |
 |
|---|
| TryLysC ESI |
 |
|---|
| Try MALDI |
 |
|---|
| ChTry MALDI |
 |
|---|
| ArgC MALDI |
 |
|---|
| LysN MALDI |
 |
|---|
| TryLysC MALDI |
 |
|---|
| Try LTQ |
 |
|---|
| ChTry LTQ |
 |
|---|
| ArgC LTQ |
 |
|---|
| LysN LTQ |
 |
|---|
| TryLysC LTQ |
 |
|---|
| Try MSlow |
 |
|---|
| ChTry MSlow |
 |
|---|
| ArgC MSlow |
 |
|---|
| LysN MSlow |
 |
|---|
| TryLysC MSlow |
 |
|---|
| Try MShigh |
 |
|---|
| ChTry MShigh |
 |
|---|
| ArgC MShigh |
 |
|---|
| LysN MShigh |
 |
|---|
| TryLysC MShigh |
 |
|---|
General Statistics
Number of major isoforms |
Number of additional isoforms |
Number of all proteins |
Number of amino acids |
Min. Seq. Length |
Max. Seq. Length |
Avg. Seq. Length |
Avg. Mol. Weight |
|---|---|---|---|---|---|---|---|
0 |
786420 |
27 |
3966 |
324.6 |
34.65 |
Amino acid frequency
Ala |
Cys |
Asp |
Glu |
Phe |
Gly |
His |
Ile |
Lys |
Leu |
|---|---|---|---|---|---|---|---|---|---|
14.173 ± 0.078 | 0.51 ± 0.01 |
5.908 ± 0.04 | 6.206 ± 0.051 |
3.203 ± 0.036 | 9.155 ± 0.046 |
1.989 ± 0.025 | 4.613 ± 0.039 |
1.75 ± 0.034 | 10.023 ± 0.059 |
Met |
Asn |
Gln |
Pro |
Arg |
Ser |
Thr |
Val |
Trp |
Tyr |
|---|---|---|---|---|---|---|---|---|---|
1.778 ± 0.022 | 1.876 ± 0.028 |
5.29 ± 0.035 | 2.903 ± 0.024 |
7.549 ± 0.056 | 5.63 ± 0.037 |
5.574 ± 0.043 | 8.626 ± 0.04 |
1.343 ± 0.019 | 1.903 ± 0.021 |
Most of the basic statistics you can see at this page can be downloaded from this CSV file
Proteome-pI is available under Creative Commons Attribution-NoDerivs license, for more details see here
| Reference: Kozlowski LP. Proteome-pI 2.0: Proteome Isoelectric Point Database Update. Nucleic Acids Res. 2021, doi: 10.1093/nar/gkab944 | Contact: Lukasz P. Kozlowski |
