Limnothrix rosea IAM M-220
Taxonomy: cellular organisms; Bacteria; Terrabacteria group; Cyanobacteria/Melainabacteria group; Cyanobacteria; Synechococcales; Pseudanabaenaceae; Limnothrix; Limnothrix rosea
Average proteome isoelectric point is 6.03
Get precalculated fractions of proteins

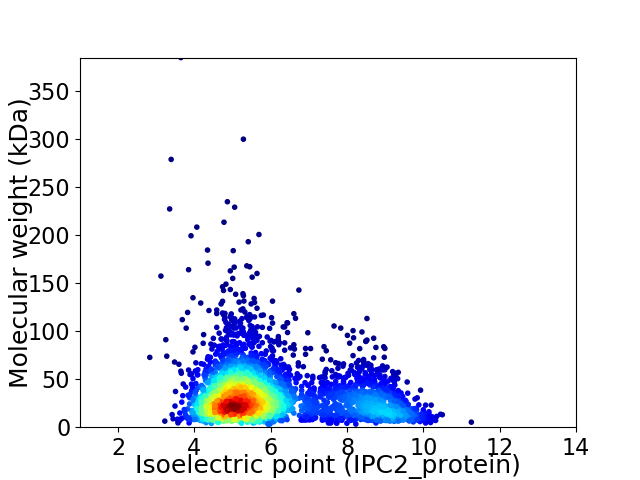
Virtual 2D-PAGE plot for 3542 proteins (isoelectric point calculated using IPC2_protein)
Get csv file with sequences according to given criteria:
* You can choose from 21 different methods for calculating isoelectric point
Summary statistics related to proteome-wise predictions


Protein with the lowest isoelectric point:
>tr|A0A1Q4R4P3|A0A1Q4R4P3_9CYAN CheR-type methyltransferase domain-containing protein OS=Limnothrix rosea IAM M-220 OX=454133 GN=NIES208_09535 PE=4 SV=1
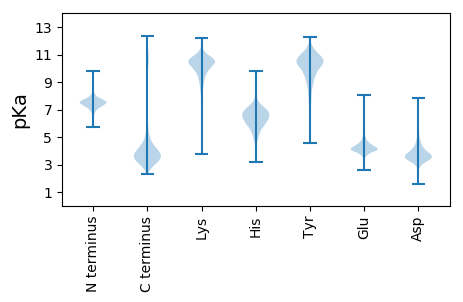
MM1 pKa = 7.86AIAPAAIQSEE11 pKa = 4.58RR12 pKa = 11.84NSVSANPFTEE22 pKa = 5.05DD23 pKa = 4.08SEE25 pKa = 5.26LPLDD29 pKa = 4.34LSLGEE34 pKa = 5.28LDD36 pKa = 3.93GSWRR40 pKa = 11.84QFRR43 pKa = 11.84IAGQYY48 pKa = 9.66EE49 pKa = 4.37FADD52 pKa = 4.77LMQTWFSLFGITNVYY67 pKa = 9.8GNTYY71 pKa = 7.98FTQGEE76 pKa = 4.39TTEE79 pKa = 4.32MGGKK83 pKa = 9.46EE84 pKa = 3.84YY85 pKa = 10.72LVAYY89 pKa = 7.93RR90 pKa = 11.84FPLAPQEE97 pKa = 4.5LDD99 pKa = 3.66LEE101 pKa = 4.65DD102 pKa = 3.7MFAVFDD108 pKa = 4.84SGQQCDD114 pKa = 3.44DD115 pKa = 3.37MSRR118 pKa = 11.84LEE120 pKa = 4.07AAILNEE126 pKa = 3.9NTKK129 pKa = 10.48VSLALLNPNTIGSLNDD145 pKa = 3.17IQTLDD150 pKa = 3.66VPGMLQASQEE160 pKa = 4.19QFAMMQEE167 pKa = 4.04TCAEE171 pKa = 4.18VNAEE175 pKa = 4.05NQVIEE180 pKa = 4.48ALDD183 pKa = 3.42NLGAINRR190 pKa = 11.84AQQDD194 pKa = 3.17FWLEE198 pKa = 3.97NKK200 pKa = 10.19RR201 pKa = 11.84FTDD204 pKa = 4.14NIEE207 pKa = 3.93SLQIGLSPEE216 pKa = 3.73TDD218 pKa = 2.94AYY220 pKa = 10.91SYY222 pKa = 11.44TMTLQNPSLVTSQAIAKK239 pKa = 9.82SPEE242 pKa = 4.12GYY244 pKa = 10.06HH245 pKa = 6.23IVGATHH251 pKa = 6.95VYY253 pKa = 11.23DD254 pKa = 5.28DD255 pKa = 4.77FDD257 pKa = 4.94SEE259 pKa = 4.73FPSTITILCEE269 pKa = 3.55KK270 pKa = 9.61SEE272 pKa = 4.38PGGPVPSLPFFDD284 pKa = 4.57EE285 pKa = 3.94ATNYY289 pKa = 8.41LACPLGTFEE298 pKa = 4.9TYY300 pKa = 10.66
MM1 pKa = 7.86AIAPAAIQSEE11 pKa = 4.58RR12 pKa = 11.84NSVSANPFTEE22 pKa = 5.05DD23 pKa = 4.08SEE25 pKa = 5.26LPLDD29 pKa = 4.34LSLGEE34 pKa = 5.28LDD36 pKa = 3.93GSWRR40 pKa = 11.84QFRR43 pKa = 11.84IAGQYY48 pKa = 9.66EE49 pKa = 4.37FADD52 pKa = 4.77LMQTWFSLFGITNVYY67 pKa = 9.8GNTYY71 pKa = 7.98FTQGEE76 pKa = 4.39TTEE79 pKa = 4.32MGGKK83 pKa = 9.46EE84 pKa = 3.84YY85 pKa = 10.72LVAYY89 pKa = 7.93RR90 pKa = 11.84FPLAPQEE97 pKa = 4.5LDD99 pKa = 3.66LEE101 pKa = 4.65DD102 pKa = 3.7MFAVFDD108 pKa = 4.84SGQQCDD114 pKa = 3.44DD115 pKa = 3.37MSRR118 pKa = 11.84LEE120 pKa = 4.07AAILNEE126 pKa = 3.9NTKK129 pKa = 10.48VSLALLNPNTIGSLNDD145 pKa = 3.17IQTLDD150 pKa = 3.66VPGMLQASQEE160 pKa = 4.19QFAMMQEE167 pKa = 4.04TCAEE171 pKa = 4.18VNAEE175 pKa = 4.05NQVIEE180 pKa = 4.48ALDD183 pKa = 3.42NLGAINRR190 pKa = 11.84AQQDD194 pKa = 3.17FWLEE198 pKa = 3.97NKK200 pKa = 10.19RR201 pKa = 11.84FTDD204 pKa = 4.14NIEE207 pKa = 3.93SLQIGLSPEE216 pKa = 3.73TDD218 pKa = 2.94AYY220 pKa = 10.91SYY222 pKa = 11.44TMTLQNPSLVTSQAIAKK239 pKa = 9.82SPEE242 pKa = 4.12GYY244 pKa = 10.06HH245 pKa = 6.23IVGATHH251 pKa = 6.95VYY253 pKa = 11.23DD254 pKa = 5.28DD255 pKa = 4.77FDD257 pKa = 4.94SEE259 pKa = 4.73FPSTITILCEE269 pKa = 3.55KK270 pKa = 9.61SEE272 pKa = 4.38PGGPVPSLPFFDD284 pKa = 4.57EE285 pKa = 3.94ATNYY289 pKa = 8.41LACPLGTFEE298 pKa = 4.9TYY300 pKa = 10.66
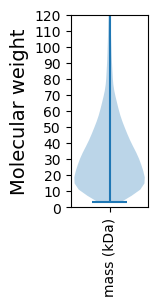
Molecular weight: 33.24 kDa
Isoelectric point according different methods:
Protein with the highest isoelectric point:
>tr|A0A1Q4R8P1|A0A1Q4R8P1_9CYAN Peptidase M16 OS=Limnothrix rosea IAM M-220 OX=454133 GN=NIES208_01680 PE=3 SV=1
MM1 pKa = 7.55TKK3 pKa = 8.94RR4 pKa = 11.84TLGGTVRR11 pKa = 11.84KK12 pKa = 9.36QKK14 pKa = 9.22RR15 pKa = 11.84TSGFRR20 pKa = 11.84ARR22 pKa = 11.84MRR24 pKa = 11.84SHH26 pKa = 6.52TGKK29 pKa = 10.03NVIRR33 pKa = 11.84ARR35 pKa = 11.84RR36 pKa = 11.84KK37 pKa = 9.01KK38 pKa = 9.6GRR40 pKa = 11.84HH41 pKa = 5.0RR42 pKa = 11.84LSVV45 pKa = 3.12
MM1 pKa = 7.55TKK3 pKa = 8.94RR4 pKa = 11.84TLGGTVRR11 pKa = 11.84KK12 pKa = 9.36QKK14 pKa = 9.22RR15 pKa = 11.84TSGFRR20 pKa = 11.84ARR22 pKa = 11.84MRR24 pKa = 11.84SHH26 pKa = 6.52TGKK29 pKa = 10.03NVIRR33 pKa = 11.84ARR35 pKa = 11.84RR36 pKa = 11.84KK37 pKa = 9.01KK38 pKa = 9.6GRR40 pKa = 11.84HH41 pKa = 5.0RR42 pKa = 11.84LSVV45 pKa = 3.12
Molecular weight: 5.26 kDa
Isoelectric point according different methods:
Peptides (in silico digests for buttom-up proteomics)
Below you can find in silico digests of the whole proteome with Trypsin, Chymotrypsin, Trypsin+LysC, LysN, ArgC proteases suitable for different mass spec machines.| Try ESI |
 |
|---|
| ChTry ESI |
 |
|---|
| ArgC ESI |
 |
|---|
| LysN ESI |
 |
|---|
| TryLysC ESI |
 |
|---|
| Try MALDI |
 |
|---|
| ChTry MALDI |
 |
|---|
| ArgC MALDI |
 |
|---|
| LysN MALDI |
 |
|---|
| TryLysC MALDI |
 |
|---|
| Try LTQ |
 |
|---|
| ChTry LTQ |
 |
|---|
| ArgC LTQ |
 |
|---|
| LysN LTQ |
 |
|---|
| TryLysC LTQ |
 |
|---|
| Try MSlow |
 |
|---|
| ChTry MSlow |
 |
|---|
| ArgC MSlow |
 |
|---|
| LysN MSlow |
 |
|---|
| TryLysC MSlow |
 |
|---|
| Try MShigh |
 |
|---|
| ChTry MShigh |
 |
|---|
| ArgC MShigh |
 |
|---|
| LysN MShigh |
 |
|---|
| TryLysC MShigh |
 |
|---|
General Statistics
Number of major isoforms |
Number of additional isoforms |
Number of all proteins |
Number of amino acids |
Min. Seq. Length |
Max. Seq. Length |
Avg. Seq. Length |
Avg. Mol. Weight |
|---|---|---|---|---|---|---|---|
0 |
1119968 |
29 |
4116 |
316.2 |
35.22 |
Amino acid frequency
Ala |
Cys |
Asp |
Glu |
Phe |
Gly |
His |
Ile |
Lys |
Leu |
|---|---|---|---|---|---|---|---|---|---|
8.482 ± 0.046 | 0.985 ± 0.015 |
5.509 ± 0.052 | 6.579 ± 0.045 |
4.194 ± 0.027 | 6.845 ± 0.093 |
1.872 ± 0.024 | 6.608 ± 0.032 |
4.771 ± 0.04 | 10.824 ± 0.052 |
Met |
Asn |
Gln |
Pro |
Arg |
Ser |
Thr |
Val |
Trp |
Tyr |
|---|---|---|---|---|---|---|---|---|---|
2.027 ± 0.019 | 4.026 ± 0.032 |
4.604 ± 0.037 | 5.132 ± 0.045 |
5.029 ± 0.038 | 6.037 ± 0.034 |
5.695 ± 0.033 | 6.44 ± 0.036 |
1.419 ± 0.02 | 2.921 ± 0.027 |
Most of the basic statistics you can see at this page can be downloaded from this CSV file
Proteome-pI is available under Creative Commons Attribution-NoDerivs license, for more details see here
| Reference: Kozlowski LP. Proteome-pI 2.0: Proteome Isoelectric Point Database Update. Nucleic Acids Res. 2021, doi: 10.1093/nar/gkab944 | Contact: Lukasz P. Kozlowski |
