Erwinia phage vB_EamM_Bosolaphorus
Taxonomy: Viruses; Duplodnaviria; Heunggongvirae; Uroviricota; Caudoviricetes; Caudovirales; Myoviridae; Agricanvirus; unclassified Agricanvirus
Average proteome isoelectric point is 6.2
Get precalculated fractions of proteins

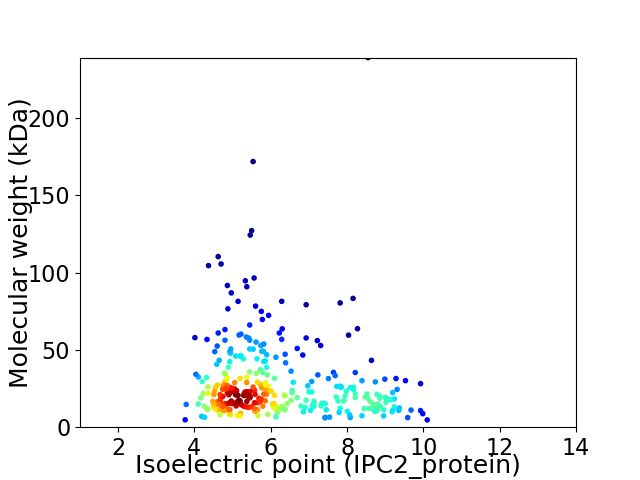
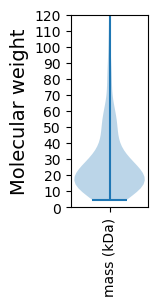
Virtual 2D-PAGE plot for 320 proteins (isoelectric point calculated using IPC2_protein)
Get csv file with sequences according to given criteria:
* You can choose from 21 different methods for calculating isoelectric point
Summary statistics related to proteome-wise predictions


Protein with the lowest isoelectric point:
>tr|A0A2H5BHK1|A0A2H5BHK1_9CAUD Putative membrane protein OS=Erwinia phage vB_EamM_Bosolaphorus OX=2060126 GN=BOSOLAPHORUS_18 PE=4 SV=1
MM1 pKa = 7.88PANQPIHH8 pKa = 6.9GEE10 pKa = 3.64GDD12 pKa = 3.87YY13 pKa = 11.37VVDD16 pKa = 3.86VALSSAEE23 pKa = 3.95LVYY26 pKa = 11.18GLINHH31 pKa = 7.29DD32 pKa = 4.08NNTDD36 pKa = 3.64YY37 pKa = 11.49TSLTLRR43 pKa = 11.84LGTPTVNTNAQHH55 pKa = 6.82DD56 pKa = 4.1RR57 pKa = 11.84NTRR60 pKa = 11.84IFAQTRR66 pKa = 11.84PGAPKK71 pKa = 9.98QGSTYY76 pKa = 10.23FYY78 pKa = 10.5YY79 pKa = 10.82DD80 pKa = 4.35RR81 pKa = 11.84ISLAYY86 pKa = 9.97YY87 pKa = 8.48LQNYY91 pKa = 7.84PDD93 pKa = 4.73LEE95 pKa = 4.14VDD97 pKa = 3.19ITDD100 pKa = 5.12DD101 pKa = 3.61MLTMRR106 pKa = 11.84DD107 pKa = 4.52LIPWMNQTFGLGLVAEE123 pKa = 4.99DD124 pKa = 4.06VRR126 pKa = 11.84ADD128 pKa = 4.73LIDD131 pKa = 3.63RR132 pKa = 11.84TPNAEE137 pKa = 3.64NRR139 pKa = 11.84FAMSAASMAWQDD151 pKa = 4.61SIVLKK156 pKa = 10.8INIPPVGIATLTGDD170 pKa = 3.88SVFDD174 pKa = 4.67AIEE177 pKa = 4.16VVSEE181 pKa = 3.94HH182 pKa = 6.55PRR184 pKa = 11.84TYY186 pKa = 10.41GQLYY190 pKa = 9.5GYY192 pKa = 10.23QVDD195 pKa = 4.09TSGMAALLTGLPIGKK210 pKa = 9.67LSNLNGEE217 pKa = 4.78NLTQALSTATSDD229 pKa = 3.16YY230 pKa = 10.04WAFDD234 pKa = 3.15ATPVVRR240 pKa = 11.84NLYY243 pKa = 9.73GATVRR248 pKa = 11.84FNGRR252 pKa = 11.84STDD255 pKa = 3.51QAVYY259 pKa = 7.86PTKK262 pKa = 10.12PDD264 pKa = 3.15NAYY267 pKa = 9.39MVIVDD272 pKa = 3.85IVEE275 pKa = 4.3SEE277 pKa = 4.14CLEE280 pKa = 4.13FEE282 pKa = 4.66GPLVLYY288 pKa = 7.29YY289 pKa = 10.48TRR291 pKa = 5.02
MM1 pKa = 7.88PANQPIHH8 pKa = 6.9GEE10 pKa = 3.64GDD12 pKa = 3.87YY13 pKa = 11.37VVDD16 pKa = 3.86VALSSAEE23 pKa = 3.95LVYY26 pKa = 11.18GLINHH31 pKa = 7.29DD32 pKa = 4.08NNTDD36 pKa = 3.64YY37 pKa = 11.49TSLTLRR43 pKa = 11.84LGTPTVNTNAQHH55 pKa = 6.82DD56 pKa = 4.1RR57 pKa = 11.84NTRR60 pKa = 11.84IFAQTRR66 pKa = 11.84PGAPKK71 pKa = 9.98QGSTYY76 pKa = 10.23FYY78 pKa = 10.5YY79 pKa = 10.82DD80 pKa = 4.35RR81 pKa = 11.84ISLAYY86 pKa = 9.97YY87 pKa = 8.48LQNYY91 pKa = 7.84PDD93 pKa = 4.73LEE95 pKa = 4.14VDD97 pKa = 3.19ITDD100 pKa = 5.12DD101 pKa = 3.61MLTMRR106 pKa = 11.84DD107 pKa = 4.52LIPWMNQTFGLGLVAEE123 pKa = 4.99DD124 pKa = 4.06VRR126 pKa = 11.84ADD128 pKa = 4.73LIDD131 pKa = 3.63RR132 pKa = 11.84TPNAEE137 pKa = 3.64NRR139 pKa = 11.84FAMSAASMAWQDD151 pKa = 4.61SIVLKK156 pKa = 10.8INIPPVGIATLTGDD170 pKa = 3.88SVFDD174 pKa = 4.67AIEE177 pKa = 4.16VVSEE181 pKa = 3.94HH182 pKa = 6.55PRR184 pKa = 11.84TYY186 pKa = 10.41GQLYY190 pKa = 9.5GYY192 pKa = 10.23QVDD195 pKa = 4.09TSGMAALLTGLPIGKK210 pKa = 9.67LSNLNGEE217 pKa = 4.78NLTQALSTATSDD229 pKa = 3.16YY230 pKa = 10.04WAFDD234 pKa = 3.15ATPVVRR240 pKa = 11.84NLYY243 pKa = 9.73GATVRR248 pKa = 11.84FNGRR252 pKa = 11.84STDD255 pKa = 3.51QAVYY259 pKa = 7.86PTKK262 pKa = 10.12PDD264 pKa = 3.15NAYY267 pKa = 9.39MVIVDD272 pKa = 3.85IVEE275 pKa = 4.3SEE277 pKa = 4.14CLEE280 pKa = 4.13FEE282 pKa = 4.66GPLVLYY288 pKa = 7.29YY289 pKa = 10.48TRR291 pKa = 5.02
Molecular weight: 32.24 kDa
Isoelectric point according different methods:
Protein with the highest isoelectric point:
>tr|A0A2H5BHV2|A0A2H5BHV2_9CAUD Dihydrofolate reductase OS=Erwinia phage vB_EamM_Bosolaphorus OX=2060126 GN=BOSOLAPHORUS_123 PE=4 SV=1
MM1 pKa = 7.94RR2 pKa = 11.84IDD4 pKa = 3.78TLSCYY9 pKa = 10.12DD10 pKa = 3.35GRR12 pKa = 11.84IPRR15 pKa = 11.84PALGVRR21 pKa = 11.84SMSIAVNRR29 pKa = 11.84HH30 pKa = 3.67HH31 pKa = 7.7AKK33 pKa = 10.14RR34 pKa = 11.84LKK36 pKa = 10.49AKK38 pKa = 10.08RR39 pKa = 11.84KK40 pKa = 9.51HH41 pKa = 4.77YY42 pKa = 9.96WNVGGKK48 pKa = 8.88RR49 pKa = 11.84QNNKK53 pKa = 9.13AVGIIFHH60 pKa = 6.24TPCKK64 pKa = 9.99CSCTMCGNQRR74 pKa = 11.84KK75 pKa = 8.25HH76 pKa = 5.28WGRR79 pKa = 11.84PIQEE83 pKa = 4.08VKK85 pKa = 9.84QAARR89 pKa = 11.84FSDD92 pKa = 3.79TVTDD96 pKa = 3.51II97 pKa = 4.19
MM1 pKa = 7.94RR2 pKa = 11.84IDD4 pKa = 3.78TLSCYY9 pKa = 10.12DD10 pKa = 3.35GRR12 pKa = 11.84IPRR15 pKa = 11.84PALGVRR21 pKa = 11.84SMSIAVNRR29 pKa = 11.84HH30 pKa = 3.67HH31 pKa = 7.7AKK33 pKa = 10.14RR34 pKa = 11.84LKK36 pKa = 10.49AKK38 pKa = 10.08RR39 pKa = 11.84KK40 pKa = 9.51HH41 pKa = 4.77YY42 pKa = 9.96WNVGGKK48 pKa = 8.88RR49 pKa = 11.84QNNKK53 pKa = 9.13AVGIIFHH60 pKa = 6.24TPCKK64 pKa = 9.99CSCTMCGNQRR74 pKa = 11.84KK75 pKa = 8.25HH76 pKa = 5.28WGRR79 pKa = 11.84PIQEE83 pKa = 4.08VKK85 pKa = 9.84QAARR89 pKa = 11.84FSDD92 pKa = 3.79TVTDD96 pKa = 3.51II97 pKa = 4.19
Molecular weight: 11.1 kDa
Isoelectric point according different methods:
Peptides (in silico digests for buttom-up proteomics)
Below you can find in silico digests of the whole proteome with Trypsin, Chymotrypsin, Trypsin+LysC, LysN, ArgC proteases suitable for different mass spec machines.| Try ESI |
 |
|---|
| ChTry ESI |
 |
|---|
| ArgC ESI |
 |
|---|
| LysN ESI |
 |
|---|
| TryLysC ESI |
 |
|---|
| Try MALDI |
 |
|---|
| ChTry MALDI |
 |
|---|
| ArgC MALDI |
 |
|---|
| LysN MALDI |
 |
|---|
| TryLysC MALDI |
 |
|---|
| Try LTQ |
 |
|---|
| ChTry LTQ |
 |
|---|
| ArgC LTQ |
 |
|---|
| LysN LTQ |
 |
|---|
| TryLysC LTQ |
 |
|---|
| Try MSlow |
 |
|---|
| ChTry MSlow |
 |
|---|
| ArgC MSlow |
 |
|---|
| LysN MSlow |
 |
|---|
| TryLysC MSlow |
 |
|---|
| Try MShigh |
 |
|---|
| ChTry MShigh |
 |
|---|
| ArgC MShigh |
 |
|---|
| LysN MShigh |
 |
|---|
| TryLysC MShigh |
 |
|---|
General Statistics
Number of major isoforms |
Number of additional isoforms |
Number of all proteins |
Number of amino acids |
Min. Seq. Length |
Max. Seq. Length |
Avg. Seq. Length |
Avg. Mol. Weight |
|---|---|---|---|---|---|---|---|
0 |
84490 |
41 |
2234 |
264.0 |
29.46 |
Amino acid frequency
Ala |
Cys |
Asp |
Glu |
Phe |
Gly |
His |
Ile |
Lys |
Leu |
|---|---|---|---|---|---|---|---|---|---|
8.202 ± 0.167 | 0.882 ± 0.046 |
6.24 ± 0.152 | 5.751 ± 0.134 |
3.586 ± 0.066 | 6.806 ± 0.305 |
2.159 ± 0.085 | 5.912 ± 0.122 |
5.292 ± 0.115 | 8.873 ± 0.126 |
Met |
Asn |
Gln |
Pro |
Arg |
Ser |
Thr |
Val |
Trp |
Tyr |
|---|---|---|---|---|---|---|---|---|---|
2.979 ± 0.086 | 5.119 ± 0.093 |
4.306 ± 0.092 | 4.077 ± 0.125 |
4.999 ± 0.117 | 5.927 ± 0.119 |
6.569 ± 0.126 | 7.226 ± 0.124 |
1.207 ± 0.046 | 3.888 ± 0.099 |
Most of the basic statistics you can see at this page can be downloaded from this CSV file
Proteome-pI is available under Creative Commons Attribution-NoDerivs license, for more details see here
| Reference: Kozlowski LP. Proteome-pI 2.0: Proteome Isoelectric Point Database Update. Nucleic Acids Res. 2021, doi: 10.1093/nar/gkab944 | Contact: Lukasz P. Kozlowski |
