Anatid alphaherpesvirus 1
Taxonomy: Viruses; Duplodnaviria; Heunggongvirae; Peploviricota; Herviviricetes; Herpesvirales; Herpesviridae; Alphaherpesvirinae; Mardivirus
Average proteome isoelectric point is 6.47
Get precalculated fractions of proteins

Virtual 2D-PAGE plot for 74 proteins (isoelectric point calculated using IPC2_protein)
Get csv file with sequences according to given criteria:
* You can choose from 21 different methods for calculating isoelectric point
Summary statistics related to proteome-wise predictions


Protein with the lowest isoelectric point:
>tr|E6Y398|E6Y398_9ALPH Tegument protein UL47 OS=Anatid alphaherpesvirus 1 OX=104388 GN=UL47 PE=3 SV=1
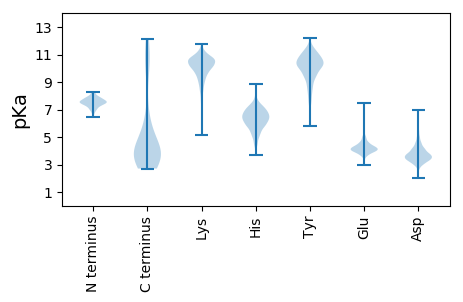
MM1 pKa = 7.21QSHH4 pKa = 7.64PATFITYY11 pKa = 8.53TLGGTGASHH20 pKa = 6.87TWTVPEE26 pKa = 4.21YY27 pKa = 9.7EE28 pKa = 4.65QVICSCDD35 pKa = 3.11GGSRR39 pKa = 11.84SVLVGNKK46 pKa = 7.29TRR48 pKa = 11.84CDD50 pKa = 3.53KK51 pKa = 11.12LPPCNVIIQRR61 pKa = 11.84GPLGTLFVVDD71 pKa = 4.0IGYY74 pKa = 10.38AIYY77 pKa = 10.39SYY79 pKa = 9.58MLRR82 pKa = 11.84CDD84 pKa = 4.65LKK86 pKa = 10.38QQVGTLSASPGSLYY100 pKa = 10.68VVPFTSCTVVGVDD113 pKa = 3.26SYY115 pKa = 11.56IRR117 pKa = 11.84SDD119 pKa = 3.19SSGVLTIAWSHH130 pKa = 4.84NTVHH134 pKa = 5.87ITITVYY140 pKa = 10.77GLSEE144 pKa = 3.94EE145 pKa = 4.37SQRR148 pKa = 11.84MASVSAISTVGQDD161 pKa = 3.51YY162 pKa = 11.31EE163 pKa = 4.19NLQDD167 pKa = 4.32IANQEE172 pKa = 3.91QSEE175 pKa = 4.23EE176 pKa = 4.24DD177 pKa = 3.86LLSAAIKK184 pKa = 9.23EE185 pKa = 4.27ANIGVDD191 pKa = 3.76YY192 pKa = 10.98ISDD195 pKa = 3.98SEE197 pKa = 4.48SSSRR201 pKa = 11.84TVMDD205 pKa = 5.24DD206 pKa = 3.94LLTSIQDD213 pKa = 3.58EE214 pKa = 4.48CLEE217 pKa = 4.32TADD220 pKa = 4.59CFCNGTSQEE229 pKa = 4.23PIAVNGIDD237 pKa = 3.07II238 pKa = 4.36
MM1 pKa = 7.21QSHH4 pKa = 7.64PATFITYY11 pKa = 8.53TLGGTGASHH20 pKa = 6.87TWTVPEE26 pKa = 4.21YY27 pKa = 9.7EE28 pKa = 4.65QVICSCDD35 pKa = 3.11GGSRR39 pKa = 11.84SVLVGNKK46 pKa = 7.29TRR48 pKa = 11.84CDD50 pKa = 3.53KK51 pKa = 11.12LPPCNVIIQRR61 pKa = 11.84GPLGTLFVVDD71 pKa = 4.0IGYY74 pKa = 10.38AIYY77 pKa = 10.39SYY79 pKa = 9.58MLRR82 pKa = 11.84CDD84 pKa = 4.65LKK86 pKa = 10.38QQVGTLSASPGSLYY100 pKa = 10.68VVPFTSCTVVGVDD113 pKa = 3.26SYY115 pKa = 11.56IRR117 pKa = 11.84SDD119 pKa = 3.19SSGVLTIAWSHH130 pKa = 4.84NTVHH134 pKa = 5.87ITITVYY140 pKa = 10.77GLSEE144 pKa = 3.94EE145 pKa = 4.37SQRR148 pKa = 11.84MASVSAISTVGQDD161 pKa = 3.51YY162 pKa = 11.31EE163 pKa = 4.19NLQDD167 pKa = 4.32IANQEE172 pKa = 3.91QSEE175 pKa = 4.23EE176 pKa = 4.24DD177 pKa = 3.86LLSAAIKK184 pKa = 9.23EE185 pKa = 4.27ANIGVDD191 pKa = 3.76YY192 pKa = 10.98ISDD195 pKa = 3.98SEE197 pKa = 4.48SSSRR201 pKa = 11.84TVMDD205 pKa = 5.24DD206 pKa = 3.94LLTSIQDD213 pKa = 3.58EE214 pKa = 4.48CLEE217 pKa = 4.32TADD220 pKa = 4.59CFCNGTSQEE229 pKa = 4.23PIAVNGIDD237 pKa = 3.07II238 pKa = 4.36
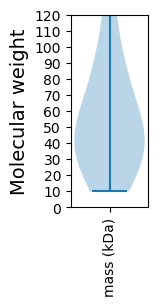
Molecular weight: 25.62 kDa
Isoelectric point according different methods:
Protein with the highest isoelectric point:
>tr|Q156E1|Q156E1_9ALPH Thymidine kinase OS=Anatid alphaherpesvirus 1 OX=104388 GN=TK PE=3 SV=1
MM1 pKa = 7.01QLVHH5 pKa = 7.14HH6 pKa = 7.25IYY8 pKa = 8.91STNISIDD15 pKa = 3.59YY16 pKa = 10.47IFIICHH22 pKa = 4.99VDD24 pKa = 3.05GLVRR28 pKa = 11.84ARR30 pKa = 11.84PRR32 pKa = 11.84PGEE35 pKa = 4.02ALDD38 pKa = 4.27PLCHH42 pKa = 6.65FPGHH46 pKa = 6.1RR47 pKa = 11.84KK48 pKa = 9.65KK49 pKa = 10.98GAGLFWRR56 pKa = 11.84GAKK59 pKa = 9.93RR60 pKa = 11.84GVAWQHH66 pKa = 6.01ANSTHH71 pKa = 5.7WAGLGLLPTPPTISPSHH88 pKa = 5.84GRR90 pKa = 11.84GLDD93 pKa = 3.29HH94 pKa = 6.69CQPRR98 pKa = 11.84PWEE101 pKa = 4.27GRR103 pKa = 11.84SRR105 pKa = 11.84PWEE108 pKa = 3.95EE109 pKa = 3.71LGLAGFQRR117 pKa = 11.84FYY119 pKa = 11.09GIRR122 pKa = 11.84VRR124 pKa = 11.84VGRR127 pKa = 11.84VPKK130 pKa = 10.12VLRR133 pKa = 11.84YY134 pKa = 9.42
MM1 pKa = 7.01QLVHH5 pKa = 7.14HH6 pKa = 7.25IYY8 pKa = 8.91STNISIDD15 pKa = 3.59YY16 pKa = 10.47IFIICHH22 pKa = 4.99VDD24 pKa = 3.05GLVRR28 pKa = 11.84ARR30 pKa = 11.84PRR32 pKa = 11.84PGEE35 pKa = 4.02ALDD38 pKa = 4.27PLCHH42 pKa = 6.65FPGHH46 pKa = 6.1RR47 pKa = 11.84KK48 pKa = 9.65KK49 pKa = 10.98GAGLFWRR56 pKa = 11.84GAKK59 pKa = 9.93RR60 pKa = 11.84GVAWQHH66 pKa = 6.01ANSTHH71 pKa = 5.7WAGLGLLPTPPTISPSHH88 pKa = 5.84GRR90 pKa = 11.84GLDD93 pKa = 3.29HH94 pKa = 6.69CQPRR98 pKa = 11.84PWEE101 pKa = 4.27GRR103 pKa = 11.84SRR105 pKa = 11.84PWEE108 pKa = 3.95EE109 pKa = 3.71LGLAGFQRR117 pKa = 11.84FYY119 pKa = 11.09GIRR122 pKa = 11.84VRR124 pKa = 11.84VGRR127 pKa = 11.84VPKK130 pKa = 10.12VLRR133 pKa = 11.84YY134 pKa = 9.42
Molecular weight: 15.22 kDa
Isoelectric point according different methods:
Peptides (in silico digests for buttom-up proteomics)
Below you can find in silico digests of the whole proteome with Trypsin, Chymotrypsin, Trypsin+LysC, LysN, ArgC proteases suitable for different mass spec machines.| Try ESI |
 |
|---|
| ChTry ESI |
 |
|---|
| ArgC ESI |
 |
|---|
| LysN ESI |
 |
|---|
| TryLysC ESI |
 |
|---|
| Try MALDI |
 |
|---|
| ChTry MALDI |
 |
|---|
| ArgC MALDI |
 |
|---|
| LysN MALDI |
 |
|---|
| TryLysC MALDI |
 |
|---|
| Try LTQ |
 |
|---|
| ChTry LTQ |
 |
|---|
| ArgC LTQ |
 |
|---|
| LysN LTQ |
 |
|---|
| TryLysC LTQ |
 |
|---|
| Try MSlow |
 |
|---|
| ChTry MSlow |
 |
|---|
| ArgC MSlow |
 |
|---|
| LysN MSlow |
 |
|---|
| TryLysC MSlow |
 |
|---|
| Try MShigh |
 |
|---|
| ChTry MShigh |
 |
|---|
| ArgC MShigh |
 |
|---|
| LysN MShigh |
 |
|---|
| TryLysC MShigh |
 |
|---|
General Statistics
Number of major isoforms |
Number of additional isoforms |
Number of all proteins |
Number of amino acids |
Min. Seq. Length |
Max. Seq. Length |
Avg. Seq. Length |
Avg. Mol. Weight |
|---|---|---|---|---|---|---|---|
0 |
40471 |
87 |
3587 |
546.9 |
60.81 |
Amino acid frequency
Ala |
Cys |
Asp |
Glu |
Phe |
Gly |
His |
Ile |
Lys |
Leu |
|---|---|---|---|---|---|---|---|---|---|
8.149 ± 0.239 | 2.229 ± 0.102 |
6.002 ± 0.153 | 5.379 ± 0.148 |
3.738 ± 0.201 | 6.239 ± 0.178 |
2.288 ± 0.074 | 5.849 ± 0.174 |
3.929 ± 0.168 | 8.796 ± 0.203 |
Met |
Asn |
Gln |
Pro |
Arg |
Ser |
Thr |
Val |
Trp |
Tyr |
|---|---|---|---|---|---|---|---|---|---|
2.636 ± 0.087 | 4.171 ± 0.09 |
5.055 ± 0.226 | 3.059 ± 0.184 |
6.773 ± 0.184 | 8.142 ± 0.274 |
6.832 ± 0.157 | 6.227 ± 0.12 |
1.09 ± 0.066 | 3.417 ± 0.118 |
Most of the basic statistics you can see at this page can be downloaded from this CSV file
Proteome-pI is available under Creative Commons Attribution-NoDerivs license, for more details see here
| Reference: Kozlowski LP. Proteome-pI 2.0: Proteome Isoelectric Point Database Update. Nucleic Acids Res. 2021, doi: 10.1093/nar/gkab944 | Contact: Lukasz P. Kozlowski |
