Zambian malbrouck virus 1
Taxonomy: Viruses; Riboviria; Orthornavirae; Pisuviricota; Pisoniviricetes; Nidovirales; Arnidovirineae; Arteriviridae; Simarterivirinae; Epsilonarterivirus; Sheartevirus; Epsilonarterivirus zamalb
Average proteome isoelectric point is 7.47
Get precalculated fractions of proteins

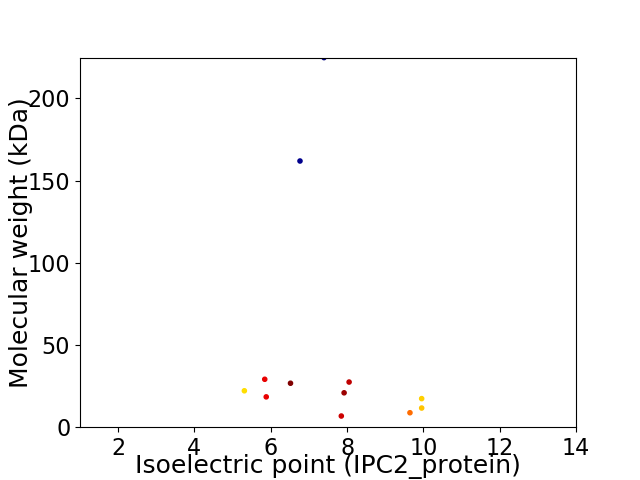
Virtual 2D-PAGE plot for 12 proteins (isoelectric point calculated using IPC2_protein)
Get csv file with sequences according to given criteria:
* You can choose from 21 different methods for calculating isoelectric point
Summary statistics related to proteome-wise predictions


Protein with the lowest isoelectric point:
>tr|A0A167L777|A0A167L777_9NIDO ORF4' protein OS=Zambian malbrouck virus 1 OX=2682610 GN=ORF4' PE=4 SV=1
MM1 pKa = 6.8VFCWLLYY8 pKa = 10.74ACLSCILFQCVCCSNNITNSSSAEE32 pKa = 4.19VPTPTCFSFPRR43 pKa = 11.84ANFSVHH49 pKa = 4.65MHH51 pKa = 6.29FEE53 pKa = 4.03ALVCKK58 pKa = 9.78MDD60 pKa = 3.63GARR63 pKa = 11.84TIGSGRR69 pKa = 11.84TSASTGGCSSVANGEE84 pKa = 4.1GRR86 pKa = 11.84WPDD89 pKa = 3.39RR90 pKa = 11.84SILQYY95 pKa = 9.62PHH97 pKa = 7.27NITADD102 pKa = 3.29FDD104 pKa = 5.01LNNTLDD110 pKa = 3.34QSHH113 pKa = 5.86AHH115 pKa = 6.09IAALLTAVLTYY126 pKa = 10.72DD127 pKa = 3.9PEE129 pKa = 4.94AFNLNPNYY137 pKa = 9.9TRR139 pKa = 11.84GFNVSTDD146 pKa = 3.21EE147 pKa = 3.92KK148 pKa = 10.92HH149 pKa = 5.78YY150 pKa = 8.59TFCVNGTILLEE161 pKa = 4.1NSTLGSYY168 pKa = 10.62YY169 pKa = 10.34FFNPHH174 pKa = 4.92TWDD177 pKa = 3.65LYY179 pKa = 9.65ILEE182 pKa = 4.49LFRR185 pKa = 11.84PFVLSLLLLSISFAA199 pKa = 4.06
MM1 pKa = 6.8VFCWLLYY8 pKa = 10.74ACLSCILFQCVCCSNNITNSSSAEE32 pKa = 4.19VPTPTCFSFPRR43 pKa = 11.84ANFSVHH49 pKa = 4.65MHH51 pKa = 6.29FEE53 pKa = 4.03ALVCKK58 pKa = 9.78MDD60 pKa = 3.63GARR63 pKa = 11.84TIGSGRR69 pKa = 11.84TSASTGGCSSVANGEE84 pKa = 4.1GRR86 pKa = 11.84WPDD89 pKa = 3.39RR90 pKa = 11.84SILQYY95 pKa = 9.62PHH97 pKa = 7.27NITADD102 pKa = 3.29FDD104 pKa = 5.01LNNTLDD110 pKa = 3.34QSHH113 pKa = 5.86AHH115 pKa = 6.09IAALLTAVLTYY126 pKa = 10.72DD127 pKa = 3.9PEE129 pKa = 4.94AFNLNPNYY137 pKa = 9.9TRR139 pKa = 11.84GFNVSTDD146 pKa = 3.21EE147 pKa = 3.92KK148 pKa = 10.92HH149 pKa = 5.78YY150 pKa = 8.59TFCVNGTILLEE161 pKa = 4.1NSTLGSYY168 pKa = 10.62YY169 pKa = 10.34FFNPHH174 pKa = 4.92TWDD177 pKa = 3.65LYY179 pKa = 9.65ILEE182 pKa = 4.49LFRR185 pKa = 11.84PFVLSLLLLSISFAA199 pKa = 4.06
Molecular weight: 22.16 kDa
Isoelectric point according different methods:
Protein with the highest isoelectric point:
>tr|A0A167L7D6|A0A167L7D6_9NIDO N protein OS=Zambian malbrouck virus 1 OX=2682610 GN=ORF7 PE=4 SV=1
MM1 pKa = 7.69AGKK4 pKa = 9.61QNRR7 pKa = 11.84QSRR10 pKa = 11.84TPQSKK15 pKa = 8.71PRR17 pKa = 11.84RR18 pKa = 11.84PRR20 pKa = 11.84RR21 pKa = 11.84RR22 pKa = 11.84PPQQSQSHH30 pKa = 5.01QNRR33 pKa = 11.84KK34 pKa = 6.33QHH36 pKa = 5.75EE37 pKa = 4.12PSFVFAAPDD46 pKa = 3.7DD47 pKa = 4.27LRR49 pKa = 11.84MKK51 pKa = 10.88LSVPNSKK58 pKa = 10.53EE59 pKa = 3.56ILRR62 pKa = 11.84LVCDD66 pKa = 4.62LFNHH70 pKa = 6.85GGGNLSYY77 pKa = 9.89EE78 pKa = 4.17NGYY81 pKa = 10.19ISYY84 pKa = 9.98QAAIAPYY91 pKa = 8.96GQLLRR96 pKa = 11.84AIQKK100 pKa = 10.45LSS102 pKa = 3.11
MM1 pKa = 7.69AGKK4 pKa = 9.61QNRR7 pKa = 11.84QSRR10 pKa = 11.84TPQSKK15 pKa = 8.71PRR17 pKa = 11.84RR18 pKa = 11.84PRR20 pKa = 11.84RR21 pKa = 11.84RR22 pKa = 11.84PPQQSQSHH30 pKa = 5.01QNRR33 pKa = 11.84KK34 pKa = 6.33QHH36 pKa = 5.75EE37 pKa = 4.12PSFVFAAPDD46 pKa = 3.7DD47 pKa = 4.27LRR49 pKa = 11.84MKK51 pKa = 10.88LSVPNSKK58 pKa = 10.53EE59 pKa = 3.56ILRR62 pKa = 11.84LVCDD66 pKa = 4.62LFNHH70 pKa = 6.85GGGNLSYY77 pKa = 9.89EE78 pKa = 4.17NGYY81 pKa = 10.19ISYY84 pKa = 9.98QAAIAPYY91 pKa = 8.96GQLLRR96 pKa = 11.84AIQKK100 pKa = 10.45LSS102 pKa = 3.11
Molecular weight: 11.66 kDa
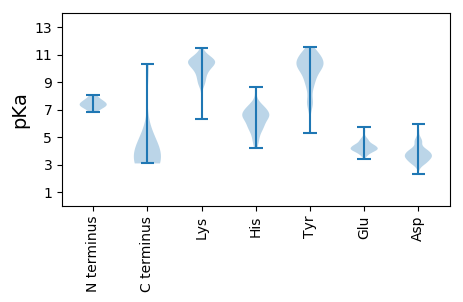
Isoelectric point according different methods:
Peptides (in silico digests for buttom-up proteomics)
Below you can find in silico digests of the whole proteome with Trypsin, Chymotrypsin, Trypsin+LysC, LysN, ArgC proteases suitable for different mass spec machines.| Try ESI |
 |
|---|
| ChTry ESI |
 |
|---|
| ArgC ESI |
 |
|---|
| LysN ESI |
 |
|---|
| TryLysC ESI |
 |
|---|
| Try MALDI |
 |
|---|
| ChTry MALDI |
 |
|---|
| ArgC MALDI |
 |
|---|
| LysN MALDI |
 |
|---|
| TryLysC MALDI |
 |
|---|
| Try LTQ |
 |
|---|
| ChTry LTQ |
 |
|---|
| ArgC LTQ |
 |
|---|
| LysN LTQ |
 |
|---|
| TryLysC LTQ |
 |
|---|
| Try MSlow |
 |
|---|
| ChTry MSlow |
 |
|---|
| ArgC MSlow |
 |
|---|
| LysN MSlow |
 |
|---|
| TryLysC MSlow |
 |
|---|
| Try MShigh |
 |
|---|
| ChTry MShigh |
 |
|---|
| ArgC MShigh |
 |
|---|
| LysN MShigh |
 |
|---|
| TryLysC MShigh |
 |
|---|
General Statistics
Number of major isoforms |
Number of additional isoforms |
Number of all proteins |
Number of amino acids |
Min. Seq. Length |
Max. Seq. Length |
Avg. Seq. Length |
Avg. Mol. Weight |
|---|---|---|---|---|---|---|---|
0 |
5250 |
59 |
2075 |
437.5 |
48.03 |
Amino acid frequency
Ala |
Cys |
Asp |
Glu |
Phe |
Gly |
His |
Ile |
Lys |
Leu |
|---|---|---|---|---|---|---|---|---|---|
8.8 ± 0.548 | 3.41 ± 0.16 |
4.514 ± 0.541 | 3.314 ± 0.191 |
4.876 ± 0.392 | 6.667 ± 0.559 |
3.143 ± 0.42 | 5.314 ± 0.399 |
4.133 ± 0.449 | 10.381 ± 0.657 |
Met |
Asn |
Gln |
Pro |
Arg |
Ser |
Thr |
Val |
Trp |
Tyr |
|---|---|---|---|---|---|---|---|---|---|
1.581 ± 0.128 | 3.467 ± 0.359 |
6.61 ± 0.628 | 2.952 ± 0.291 |
4.667 ± 0.242 | 6.8 ± 0.573 |
7.371 ± 0.349 | 7.162 ± 0.54 |
1.143 ± 0.166 | 3.695 ± 0.249 |
Most of the basic statistics you can see at this page can be downloaded from this CSV file
Proteome-pI is available under Creative Commons Attribution-NoDerivs license, for more details see here
| Reference: Kozlowski LP. Proteome-pI 2.0: Proteome Isoelectric Point Database Update. Nucleic Acids Res. 2021, doi: 10.1093/nar/gkab944 | Contact: Lukasz P. Kozlowski |
