Amorphotheca resinae ATCC 22711
Taxonomy: cellular organisms; Eukaryota; Opisthokonta; Fungi; Dikarya; Ascomycota; saccharomyceta; Pezizomycotina; leotiomyceta; sordariomyceta; Leotiomycetes; Leotiomycetes incertae sedis; Myxotrichaceae; Amorphotheca; Amorphotheca resinae
Average proteome isoelectric point is 6.68
Get precalculated fractions of proteins

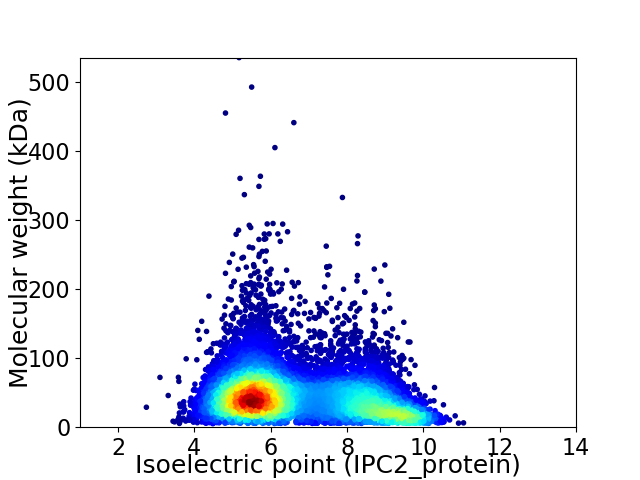
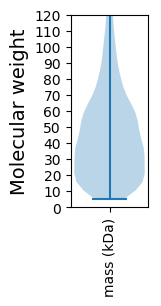
Virtual 2D-PAGE plot for 9640 proteins (isoelectric point calculated using IPC2_protein)
Get csv file with sequences according to given criteria:
* You can choose from 21 different methods for calculating isoelectric point
Summary statistics related to proteome-wise predictions


Protein with the lowest isoelectric point:
>tr|A0A2T3B8W6|A0A2T3B8W6_AMORE Uncharacterized protein (Fragment) OS=Amorphotheca resinae ATCC 22711 OX=857342 GN=M430DRAFT_117406 PE=4 SV=1
MM1 pKa = 7.74PSSLIYY7 pKa = 10.58SNHH10 pKa = 6.74DD11 pKa = 3.32PSPSVTCPICLDD23 pKa = 3.72PVTAEE28 pKa = 4.06AVRR31 pKa = 11.84LSCHH35 pKa = 6.06LQLHH39 pKa = 6.32CSEE42 pKa = 5.55CIGYY46 pKa = 8.88WLGSLVAAAKK56 pKa = 10.1RR57 pKa = 11.84VTCPKK62 pKa = 9.78CRR64 pKa = 11.84EE65 pKa = 4.03AVTVEE70 pKa = 3.87NLRR73 pKa = 11.84APEE76 pKa = 4.41QNVEE80 pKa = 3.91WQDD83 pKa = 3.56PDD85 pKa = 3.54GDD87 pKa = 4.13EE88 pKa = 4.21YY89 pKa = 11.43DD90 pKa = 4.02YY91 pKa = 11.26DD92 pKa = 4.4YY93 pKa = 11.75DD94 pKa = 6.33DD95 pKa = 5.19YY96 pKa = 12.04DD97 pKa = 5.99DD98 pKa = 5.63YY99 pKa = 12.06DD100 pKa = 3.67DD101 pKa = 4.66TEE103 pKa = 4.44VEE105 pKa = 4.12EE106 pKa = 4.29EE107 pKa = 4.15NRR109 pKa = 11.84DD110 pKa = 3.68SEE112 pKa = 4.24EE113 pKa = 4.39DD114 pKa = 3.43QDD116 pKa = 3.71EE117 pKa = 4.67DD118 pKa = 5.23GYY120 pKa = 11.23QSSDD124 pKa = 3.14IEE126 pKa = 5.69DD127 pKa = 3.58GLNYY131 pKa = 10.53YY132 pKa = 10.5GADD135 pKa = 3.28QDD137 pKa = 4.14EE138 pKa = 4.58NEE140 pKa = 4.5DD141 pKa = 4.31LISGEE146 pKa = 4.05MGEE149 pKa = 5.85DD150 pKa = 2.78IDD152 pKa = 5.97AYY154 pKa = 10.46EE155 pKa = 4.36EE156 pKa = 4.37DD157 pKa = 3.41EE158 pKa = 4.54GGIFEE163 pKa = 5.24RR164 pKa = 11.84DD165 pKa = 3.21PDD167 pKa = 3.79EE168 pKa = 7.27DD169 pKa = 4.12EE170 pKa = 5.65DD171 pKa = 4.68QMSDD175 pKa = 3.19EE176 pKa = 4.38MKK178 pKa = 9.62GTEE181 pKa = 4.05SEE183 pKa = 4.31EE184 pKa = 4.17PKK186 pKa = 10.59EE187 pKa = 3.97GLQVTVRR194 pKa = 11.84EE195 pKa = 4.15EE196 pKa = 4.03PPNKK200 pKa = 9.32KK201 pKa = 10.02RR202 pKa = 11.84SISPPIGVSIPRR214 pKa = 11.84QNSQTMKK221 pKa = 10.83DD222 pKa = 3.67GAQQ225 pKa = 3.05
MM1 pKa = 7.74PSSLIYY7 pKa = 10.58SNHH10 pKa = 6.74DD11 pKa = 3.32PSPSVTCPICLDD23 pKa = 3.72PVTAEE28 pKa = 4.06AVRR31 pKa = 11.84LSCHH35 pKa = 6.06LQLHH39 pKa = 6.32CSEE42 pKa = 5.55CIGYY46 pKa = 8.88WLGSLVAAAKK56 pKa = 10.1RR57 pKa = 11.84VTCPKK62 pKa = 9.78CRR64 pKa = 11.84EE65 pKa = 4.03AVTVEE70 pKa = 3.87NLRR73 pKa = 11.84APEE76 pKa = 4.41QNVEE80 pKa = 3.91WQDD83 pKa = 3.56PDD85 pKa = 3.54GDD87 pKa = 4.13EE88 pKa = 4.21YY89 pKa = 11.43DD90 pKa = 4.02YY91 pKa = 11.26DD92 pKa = 4.4YY93 pKa = 11.75DD94 pKa = 6.33DD95 pKa = 5.19YY96 pKa = 12.04DD97 pKa = 5.99DD98 pKa = 5.63YY99 pKa = 12.06DD100 pKa = 3.67DD101 pKa = 4.66TEE103 pKa = 4.44VEE105 pKa = 4.12EE106 pKa = 4.29EE107 pKa = 4.15NRR109 pKa = 11.84DD110 pKa = 3.68SEE112 pKa = 4.24EE113 pKa = 4.39DD114 pKa = 3.43QDD116 pKa = 3.71EE117 pKa = 4.67DD118 pKa = 5.23GYY120 pKa = 11.23QSSDD124 pKa = 3.14IEE126 pKa = 5.69DD127 pKa = 3.58GLNYY131 pKa = 10.53YY132 pKa = 10.5GADD135 pKa = 3.28QDD137 pKa = 4.14EE138 pKa = 4.58NEE140 pKa = 4.5DD141 pKa = 4.31LISGEE146 pKa = 4.05MGEE149 pKa = 5.85DD150 pKa = 2.78IDD152 pKa = 5.97AYY154 pKa = 10.46EE155 pKa = 4.36EE156 pKa = 4.37DD157 pKa = 3.41EE158 pKa = 4.54GGIFEE163 pKa = 5.24RR164 pKa = 11.84DD165 pKa = 3.21PDD167 pKa = 3.79EE168 pKa = 7.27DD169 pKa = 4.12EE170 pKa = 5.65DD171 pKa = 4.68QMSDD175 pKa = 3.19EE176 pKa = 4.38MKK178 pKa = 9.62GTEE181 pKa = 4.05SEE183 pKa = 4.31EE184 pKa = 4.17PKK186 pKa = 10.59EE187 pKa = 3.97GLQVTVRR194 pKa = 11.84EE195 pKa = 4.15EE196 pKa = 4.03PPNKK200 pKa = 9.32KK201 pKa = 10.02RR202 pKa = 11.84SISPPIGVSIPRR214 pKa = 11.84QNSQTMKK221 pKa = 10.83DD222 pKa = 3.67GAQQ225 pKa = 3.05
Molecular weight: 25.35 kDa
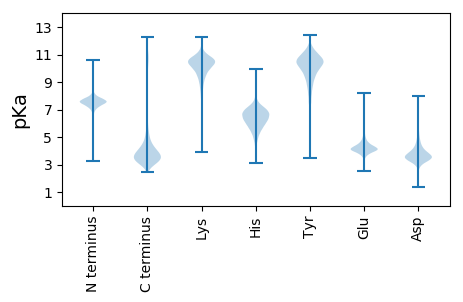
Isoelectric point according different methods:
Protein with the highest isoelectric point:
>tr|A0A2T3BFI4|A0A2T3BFI4_AMORE Amidase domain-containing protein OS=Amorphotheca resinae ATCC 22711 OX=857342 GN=M430DRAFT_24495 PE=4 SV=1
MM1 pKa = 6.93NTLATNPPSLFTFRR15 pKa = 11.84PPAPPPLRR23 pKa = 11.84QSVSQSLRR31 pKa = 11.84PSSPTMRR38 pKa = 11.84SSRR41 pKa = 11.84SSLINRR47 pKa = 11.84PPSLPPPP54 pKa = 3.99
MM1 pKa = 6.93NTLATNPPSLFTFRR15 pKa = 11.84PPAPPPLRR23 pKa = 11.84QSVSQSLRR31 pKa = 11.84PSSPTMRR38 pKa = 11.84SSRR41 pKa = 11.84SSLINRR47 pKa = 11.84PPSLPPPP54 pKa = 3.99
Molecular weight: 5.87 kDa
Isoelectric point according different methods:
Peptides (in silico digests for buttom-up proteomics)
Below you can find in silico digests of the whole proteome with Trypsin, Chymotrypsin, Trypsin+LysC, LysN, ArgC proteases suitable for different mass spec machines.| Try ESI |
 |
|---|
| ChTry ESI |
 |
|---|
| ArgC ESI |
 |
|---|
| LysN ESI |
 |
|---|
| TryLysC ESI |
 |
|---|
| Try MALDI |
 |
|---|
| ChTry MALDI |
 |
|---|
| ArgC MALDI |
 |
|---|
| LysN MALDI |
 |
|---|
| TryLysC MALDI |
 |
|---|
| Try LTQ |
 |
|---|
| ChTry LTQ |
 |
|---|
| ArgC LTQ |
 |
|---|
| LysN LTQ |
 |
|---|
| TryLysC LTQ |
 |
|---|
| Try MSlow |
 |
|---|
| ChTry MSlow |
 |
|---|
| ArgC MSlow |
 |
|---|
| LysN MSlow |
 |
|---|
| TryLysC MSlow |
 |
|---|
| Try MShigh |
 |
|---|
| ChTry MShigh |
 |
|---|
| ArgC MShigh |
 |
|---|
| LysN MShigh |
 |
|---|
| TryLysC MShigh |
 |
|---|
General Statistics
Number of major isoforms |
Number of additional isoforms |
Number of all proteins |
Number of amino acids |
Min. Seq. Length |
Max. Seq. Length |
Avg. Seq. Length |
Avg. Mol. Weight |
|---|---|---|---|---|---|---|---|
0 |
4384405 |
49 |
4859 |
454.8 |
50.35 |
Amino acid frequency
Ala |
Cys |
Asp |
Glu |
Phe |
Gly |
His |
Ile |
Lys |
Leu |
|---|---|---|---|---|---|---|---|---|---|
8.366 ± 0.022 | 1.172 ± 0.009 |
5.543 ± 0.018 | 6.454 ± 0.027 |
3.651 ± 0.018 | 6.944 ± 0.023 |
2.282 ± 0.009 | 5.055 ± 0.02 |
5.123 ± 0.022 | 8.829 ± 0.028 |
Met |
Asn |
Gln |
Pro |
Arg |
Ser |
Thr |
Val |
Trp |
Tyr |
|---|---|---|---|---|---|---|---|---|---|
2.163 ± 0.009 | 3.689 ± 0.015 |
6.264 ± 0.027 | 3.914 ± 0.02 |
6.175 ± 0.024 | 8.443 ± 0.03 |
5.871 ± 0.016 | 5.892 ± 0.018 |
1.396 ± 0.009 | 2.774 ± 0.012 |
Most of the basic statistics you can see at this page can be downloaded from this CSV file
Proteome-pI is available under Creative Commons Attribution-NoDerivs license, for more details see here
| Reference: Kozlowski LP. Proteome-pI 2.0: Proteome Isoelectric Point Database Update. Nucleic Acids Res. 2021, doi: 10.1093/nar/gkab944 | Contact: Lukasz P. Kozlowski |
