Lutibaculum baratangense AMV1
Taxonomy: cellular organisms; Bacteria; Proteobacteria; Alphaproteobacteria; Hyphomicrobiales; Tepidamorphaceae; Lutibaculum; Lutibaculum baratangense
Average proteome isoelectric point is 6.3
Get precalculated fractions of proteins

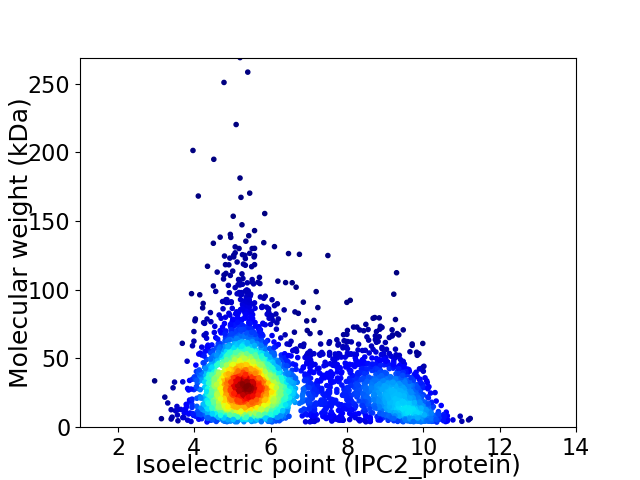
Virtual 2D-PAGE plot for 4164 proteins (isoelectric point calculated using IPC2_protein)
Get csv file with sequences according to given criteria:
* You can choose from 21 different methods for calculating isoelectric point
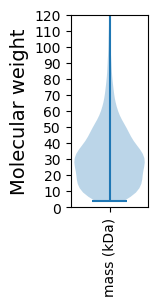
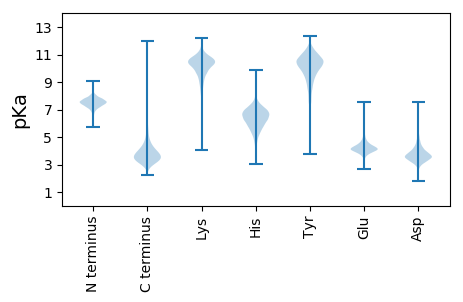
Summary statistics related to proteome-wise predictions


Protein with the lowest isoelectric point:
>tr|V4R2N0|V4R2N0_9RHIZ Uncharacterized protein OS=Lutibaculum baratangense AMV1 OX=631454 GN=N177_1071 PE=4 SV=1
MM1 pKa = 7.05NRR3 pKa = 11.84FVRR6 pKa = 11.84TLTLGAAVAVLATAANAADD25 pKa = 3.36APYY28 pKa = 10.04YY29 pKa = 10.28DD30 pKa = 4.18KK31 pKa = 11.58NVVVSPAPVSVTDD44 pKa = 3.29WTGMYY49 pKa = 10.14VGVFGGYY56 pKa = 10.0GGGDD60 pKa = 3.24FEE62 pKa = 5.57YY63 pKa = 9.43PFSVGSPALLSGQVDD78 pKa = 3.8MSAGGFVGGAQIGFDD93 pKa = 3.65WQASDD98 pKa = 3.5AFVVGVVADD107 pKa = 4.15IAWSDD112 pKa = 3.15ISDD115 pKa = 3.7EE116 pKa = 4.41VSVSLAAATDD126 pKa = 4.79PITRR130 pKa = 11.84VNGSLGTDD138 pKa = 3.58LNYY141 pKa = 10.6FGTIRR146 pKa = 11.84ARR148 pKa = 11.84AGWLVTPDD156 pKa = 3.07ALLYY160 pKa = 8.53VTGGAAYY167 pKa = 10.26GEE169 pKa = 4.56TEE171 pKa = 4.17SALSLSASGAVDD183 pKa = 3.85GSFGASTSDD192 pKa = 3.66TDD194 pKa = 3.53WGWTVGAGMEE204 pKa = 3.98YY205 pKa = 10.29RR206 pKa = 11.84ITEE209 pKa = 4.02NVSFEE214 pKa = 4.19TEE216 pKa = 3.96YY217 pKa = 11.13LYY219 pKa = 11.48VDD221 pKa = 4.62LGSKK225 pKa = 8.04TLYY228 pKa = 10.73SGDD231 pKa = 3.89VFDD234 pKa = 6.26LPARR238 pKa = 11.84LDD240 pKa = 3.93LDD242 pKa = 3.72TSFHH246 pKa = 5.28VVRR249 pKa = 11.84AGVNFKK255 pKa = 11.3FNMFF259 pKa = 3.72
MM1 pKa = 7.05NRR3 pKa = 11.84FVRR6 pKa = 11.84TLTLGAAVAVLATAANAADD25 pKa = 3.36APYY28 pKa = 10.04YY29 pKa = 10.28DD30 pKa = 4.18KK31 pKa = 11.58NVVVSPAPVSVTDD44 pKa = 3.29WTGMYY49 pKa = 10.14VGVFGGYY56 pKa = 10.0GGGDD60 pKa = 3.24FEE62 pKa = 5.57YY63 pKa = 9.43PFSVGSPALLSGQVDD78 pKa = 3.8MSAGGFVGGAQIGFDD93 pKa = 3.65WQASDD98 pKa = 3.5AFVVGVVADD107 pKa = 4.15IAWSDD112 pKa = 3.15ISDD115 pKa = 3.7EE116 pKa = 4.41VSVSLAAATDD126 pKa = 4.79PITRR130 pKa = 11.84VNGSLGTDD138 pKa = 3.58LNYY141 pKa = 10.6FGTIRR146 pKa = 11.84ARR148 pKa = 11.84AGWLVTPDD156 pKa = 3.07ALLYY160 pKa = 8.53VTGGAAYY167 pKa = 10.26GEE169 pKa = 4.56TEE171 pKa = 4.17SALSLSASGAVDD183 pKa = 3.85GSFGASTSDD192 pKa = 3.66TDD194 pKa = 3.53WGWTVGAGMEE204 pKa = 3.98YY205 pKa = 10.29RR206 pKa = 11.84ITEE209 pKa = 4.02NVSFEE214 pKa = 4.19TEE216 pKa = 3.96YY217 pKa = 11.13LYY219 pKa = 11.48VDD221 pKa = 4.62LGSKK225 pKa = 8.04TLYY228 pKa = 10.73SGDD231 pKa = 3.89VFDD234 pKa = 6.26LPARR238 pKa = 11.84LDD240 pKa = 3.93LDD242 pKa = 3.72TSFHH246 pKa = 5.28VVRR249 pKa = 11.84AGVNFKK255 pKa = 11.3FNMFF259 pKa = 3.72
Molecular weight: 27.08 kDa
Isoelectric point according different methods:
Protein with the highest isoelectric point:
>tr|V4RAY5|V4RAY5_9RHIZ Transcription regulator OS=Lutibaculum baratangense AMV1 OX=631454 GN=N177_3700 PE=4 SV=1
MM1 pKa = 7.41AAALGTGSISRR12 pKa = 11.84LRR14 pKa = 11.84TLRR17 pKa = 11.84ARR19 pKa = 11.84ATLFLIRR26 pKa = 11.84NKK28 pKa = 9.96FSNRR32 pKa = 11.84KK33 pKa = 8.35RR34 pKa = 11.84VRR36 pKa = 11.84AGWRR40 pKa = 11.84HH41 pKa = 3.76GHH43 pKa = 6.16GPSSPPAGTRR53 pKa = 11.84RR54 pKa = 11.84PSAQQ58 pKa = 2.93
MM1 pKa = 7.41AAALGTGSISRR12 pKa = 11.84LRR14 pKa = 11.84TLRR17 pKa = 11.84ARR19 pKa = 11.84ATLFLIRR26 pKa = 11.84NKK28 pKa = 9.96FSNRR32 pKa = 11.84KK33 pKa = 8.35RR34 pKa = 11.84VRR36 pKa = 11.84AGWRR40 pKa = 11.84HH41 pKa = 3.76GHH43 pKa = 6.16GPSSPPAGTRR53 pKa = 11.84RR54 pKa = 11.84PSAQQ58 pKa = 2.93
Molecular weight: 6.35 kDa
Isoelectric point according different methods:
Peptides (in silico digests for buttom-up proteomics)
Below you can find in silico digests of the whole proteome with Trypsin, Chymotrypsin, Trypsin+LysC, LysN, ArgC proteases suitable for different mass spec machines.| Try ESI |
 |
|---|
| ChTry ESI |
 |
|---|
| ArgC ESI |
 |
|---|
| LysN ESI |
 |
|---|
| TryLysC ESI |
 |
|---|
| Try MALDI |
 |
|---|
| ChTry MALDI |
 |
|---|
| ArgC MALDI |
 |
|---|
| LysN MALDI |
 |
|---|
| TryLysC MALDI |
 |
|---|
| Try LTQ |
 |
|---|
| ChTry LTQ |
 |
|---|
| ArgC LTQ |
 |
|---|
| LysN LTQ |
 |
|---|
| TryLysC LTQ |
 |
|---|
| Try MSlow |
 |
|---|
| ChTry MSlow |
 |
|---|
| ArgC MSlow |
 |
|---|
| LysN MSlow |
 |
|---|
| TryLysC MSlow |
 |
|---|
| Try MShigh |
 |
|---|
| ChTry MShigh |
 |
|---|
| ArgC MShigh |
 |
|---|
| LysN MShigh |
 |
|---|
| TryLysC MShigh |
 |
|---|
General Statistics
Number of major isoforms |
Number of additional isoforms |
Number of all proteins |
Number of amino acids |
Min. Seq. Length |
Max. Seq. Length |
Avg. Seq. Length |
Avg. Mol. Weight |
|---|---|---|---|---|---|---|---|
0 |
1287530 |
37 |
2455 |
309.2 |
33.55 |
Amino acid frequency
Ala |
Cys |
Asp |
Glu |
Phe |
Gly |
His |
Ile |
Lys |
Leu |
|---|---|---|---|---|---|---|---|---|---|
12.56 ± 0.056 | 0.818 ± 0.012 |
5.596 ± 0.033 | 6.739 ± 0.039 |
3.621 ± 0.026 | 9.014 ± 0.036 |
2.076 ± 0.018 | 4.714 ± 0.032 |
2.509 ± 0.028 | 10.184 ± 0.046 |
Met |
Asn |
Gln |
Pro |
Arg |
Ser |
Thr |
Val |
Trp |
Tyr |
|---|---|---|---|---|---|---|---|---|---|
2.473 ± 0.018 | 2.135 ± 0.018 |
5.342 ± 0.03 | 2.809 ± 0.023 |
7.963 ± 0.044 | 5.114 ± 0.026 |
5.06 ± 0.028 | 7.853 ± 0.033 |
1.318 ± 0.017 | 2.101 ± 0.02 |
Most of the basic statistics you can see at this page can be downloaded from this CSV file
Proteome-pI is available under Creative Commons Attribution-NoDerivs license, for more details see here
| Reference: Kozlowski LP. Proteome-pI 2.0: Proteome Isoelectric Point Database Update. Nucleic Acids Res. 2021, doi: 10.1093/nar/gkab944 | Contact: Lukasz P. Kozlowski |
