Oceanobacillus iheyensis (strain DSM 14371 / CIP 107618 / JCM 11309 / KCTC 3954 / HTE831)
Taxonomy: cellular organisms; Bacteria; Terrabacteria group; Firmicutes; Bacilli; Bacillales; Bacillaceae; Oceanobacillus; Oceanobacillus iheyensis
Average proteome isoelectric point is 6.01
Get precalculated fractions of proteins

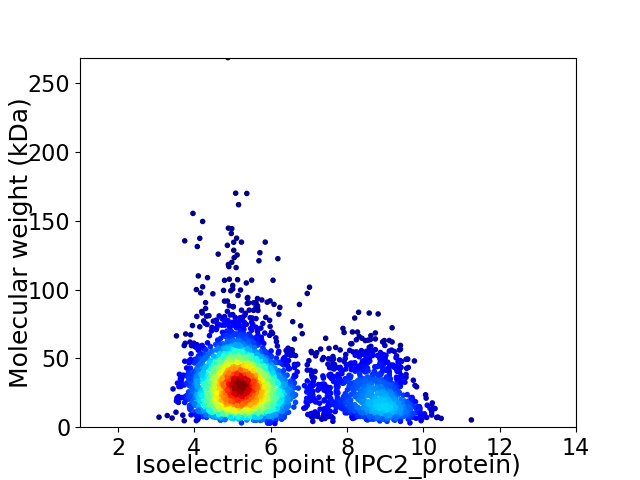
Virtual 2D-PAGE plot for 3490 proteins (isoelectric point calculated using IPC2_protein)
Get csv file with sequences according to given criteria:
* You can choose from 21 different methods for calculating isoelectric point
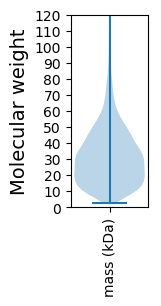
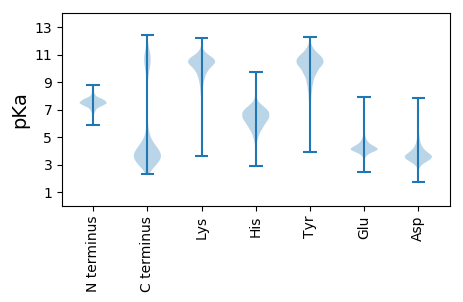
Summary statistics related to proteome-wise predictions


Protein with the lowest isoelectric point:
>tr|Q8CXM1|Q8CXM1_OCEIH Leader peptide processing enzyme (Late competence protein) OS=Oceanobacillus iheyensis (strain DSM 14371 / CIP 107618 / JCM 11309 / KCTC 3954 / HTE831) OX=221109 GN=OB0617 PE=3 SV=1
MM1 pKa = 7.25EE2 pKa = 5.37AANLFKK8 pKa = 10.83KK9 pKa = 10.54IFGFMLLLVLVGLLLGNIIQSNYY32 pKa = 9.36EE33 pKa = 4.26DD34 pKa = 3.55NHH36 pKa = 7.41SDD38 pKa = 2.95TDD40 pKa = 3.73YY41 pKa = 11.48HH42 pKa = 6.13VTGDD46 pKa = 3.93DD47 pKa = 3.51NMEE50 pKa = 4.53GGSIAPVDD58 pKa = 4.21SVGLEE63 pKa = 4.32PGDD66 pKa = 3.72KK67 pKa = 11.04APDD70 pKa = 3.69FEE72 pKa = 6.17LEE74 pKa = 4.18TLEE77 pKa = 4.61GEE79 pKa = 4.52SFRR82 pKa = 11.84LSDD85 pKa = 3.68YY86 pKa = 10.49QGKK89 pKa = 9.49KK90 pKa = 9.85VILNFWYY97 pKa = 8.38TWCPPCKK104 pKa = 10.02EE105 pKa = 4.72EE106 pKa = 3.96MPEE109 pKa = 3.86MQEE112 pKa = 4.9FYY114 pKa = 11.02DD115 pKa = 4.06DD116 pKa = 3.66YY117 pKa = 11.17KK118 pKa = 11.44EE119 pKa = 3.92EE120 pKa = 4.2VEE122 pKa = 4.15IVTVNMTEE130 pKa = 4.2YY131 pKa = 10.8EE132 pKa = 4.13KK133 pKa = 10.05TQQNVQDD140 pKa = 5.8FIDD143 pKa = 4.5EE144 pKa = 4.21YY145 pKa = 11.3DD146 pKa = 3.53FTFTVPLDD154 pKa = 3.82KK155 pKa = 11.15NSEE158 pKa = 4.0VSDD161 pKa = 4.34LYY163 pKa = 10.74TIYY166 pKa = 10.65AAPSTYY172 pKa = 10.4FIGTDD177 pKa = 4.01GIVQQEE183 pKa = 4.21RR184 pKa = 11.84KK185 pKa = 9.01IGPMDD190 pKa = 3.63YY191 pKa = 11.14EE192 pKa = 4.77FMQEE196 pKa = 3.8MVEE199 pKa = 4.52GINN202 pKa = 3.79
MM1 pKa = 7.25EE2 pKa = 5.37AANLFKK8 pKa = 10.83KK9 pKa = 10.54IFGFMLLLVLVGLLLGNIIQSNYY32 pKa = 9.36EE33 pKa = 4.26DD34 pKa = 3.55NHH36 pKa = 7.41SDD38 pKa = 2.95TDD40 pKa = 3.73YY41 pKa = 11.48HH42 pKa = 6.13VTGDD46 pKa = 3.93DD47 pKa = 3.51NMEE50 pKa = 4.53GGSIAPVDD58 pKa = 4.21SVGLEE63 pKa = 4.32PGDD66 pKa = 3.72KK67 pKa = 11.04APDD70 pKa = 3.69FEE72 pKa = 6.17LEE74 pKa = 4.18TLEE77 pKa = 4.61GEE79 pKa = 4.52SFRR82 pKa = 11.84LSDD85 pKa = 3.68YY86 pKa = 10.49QGKK89 pKa = 9.49KK90 pKa = 9.85VILNFWYY97 pKa = 8.38TWCPPCKK104 pKa = 10.02EE105 pKa = 4.72EE106 pKa = 3.96MPEE109 pKa = 3.86MQEE112 pKa = 4.9FYY114 pKa = 11.02DD115 pKa = 4.06DD116 pKa = 3.66YY117 pKa = 11.17KK118 pKa = 11.44EE119 pKa = 3.92EE120 pKa = 4.2VEE122 pKa = 4.15IVTVNMTEE130 pKa = 4.2YY131 pKa = 10.8EE132 pKa = 4.13KK133 pKa = 10.05TQQNVQDD140 pKa = 5.8FIDD143 pKa = 4.5EE144 pKa = 4.21YY145 pKa = 11.3DD146 pKa = 3.53FTFTVPLDD154 pKa = 3.82KK155 pKa = 11.15NSEE158 pKa = 4.0VSDD161 pKa = 4.34LYY163 pKa = 10.74TIYY166 pKa = 10.65AAPSTYY172 pKa = 10.4FIGTDD177 pKa = 4.01GIVQQEE183 pKa = 4.21RR184 pKa = 11.84KK185 pKa = 9.01IGPMDD190 pKa = 3.63YY191 pKa = 11.14EE192 pKa = 4.77FMQEE196 pKa = 3.8MVEE199 pKa = 4.52GINN202 pKa = 3.79
Molecular weight: 23.24 kDa
Isoelectric point according different methods:
Protein with the highest isoelectric point:
>tr|Q8ELW8|Q8ELW8_OCEIH Hypothetical conserved protein OS=Oceanobacillus iheyensis (strain DSM 14371 / CIP 107618 / JCM 11309 / KCTC 3954 / HTE831) OX=221109 GN=OB3096 PE=4 SV=1
MM1 pKa = 7.44KK2 pKa = 9.6RR3 pKa = 11.84TFQPNNRR10 pKa = 11.84KK11 pKa = 9.23RR12 pKa = 11.84KK13 pKa = 8.22KK14 pKa = 8.69VHH16 pKa = 5.46GFRR19 pKa = 11.84ARR21 pKa = 11.84MSTKK25 pKa = 10.08NGRR28 pKa = 11.84NVLARR33 pKa = 11.84RR34 pKa = 11.84RR35 pKa = 11.84RR36 pKa = 11.84KK37 pKa = 9.05GRR39 pKa = 11.84KK40 pKa = 8.7VLSAA44 pKa = 4.05
MM1 pKa = 7.44KK2 pKa = 9.6RR3 pKa = 11.84TFQPNNRR10 pKa = 11.84KK11 pKa = 9.23RR12 pKa = 11.84KK13 pKa = 8.22KK14 pKa = 8.69VHH16 pKa = 5.46GFRR19 pKa = 11.84ARR21 pKa = 11.84MSTKK25 pKa = 10.08NGRR28 pKa = 11.84NVLARR33 pKa = 11.84RR34 pKa = 11.84RR35 pKa = 11.84RR36 pKa = 11.84KK37 pKa = 9.05GRR39 pKa = 11.84KK40 pKa = 8.7VLSAA44 pKa = 4.05
Molecular weight: 5.29 kDa
Isoelectric point according different methods:
Peptides (in silico digests for buttom-up proteomics)
Below you can find in silico digests of the whole proteome with Trypsin, Chymotrypsin, Trypsin+LysC, LysN, ArgC proteases suitable for different mass spec machines.| Try ESI |
 |
|---|
| ChTry ESI |
 |
|---|
| ArgC ESI |
 |
|---|
| LysN ESI |
 |
|---|
| TryLysC ESI |
 |
|---|
| Try MALDI |
 |
|---|
| ChTry MALDI |
 |
|---|
| ArgC MALDI |
 |
|---|
| LysN MALDI |
 |
|---|
| TryLysC MALDI |
 |
|---|
| Try LTQ |
 |
|---|
| ChTry LTQ |
 |
|---|
| ArgC LTQ |
 |
|---|
| LysN LTQ |
 |
|---|
| TryLysC LTQ |
 |
|---|
| Try MSlow |
 |
|---|
| ChTry MSlow |
 |
|---|
| ArgC MSlow |
 |
|---|
| LysN MSlow |
 |
|---|
| TryLysC MSlow |
 |
|---|
| Try MShigh |
 |
|---|
| ChTry MShigh |
 |
|---|
| ArgC MShigh |
 |
|---|
| LysN MShigh |
 |
|---|
| TryLysC MShigh |
 |
|---|
General Statistics
Number of major isoforms |
Number of additional isoforms |
Number of all proteins |
Number of amino acids |
Min. Seq. Length |
Max. Seq. Length |
Avg. Seq. Length |
Avg. Mol. Weight |
|---|---|---|---|---|---|---|---|
0 |
1017601 |
24 |
2373 |
291.6 |
32.81 |
Amino acid frequency
Ala |
Cys |
Asp |
Glu |
Phe |
Gly |
His |
Ile |
Lys |
Leu |
|---|---|---|---|---|---|---|---|---|---|
6.5 ± 0.045 | 0.605 ± 0.011 |
5.474 ± 0.04 | 7.66 ± 0.055 |
4.454 ± 0.036 | 6.696 ± 0.045 |
2.14 ± 0.019 | 8.533 ± 0.049 |
6.416 ± 0.042 | 9.418 ± 0.042 |
Met |
Asn |
Gln |
Pro |
Arg |
Ser |
Thr |
Val |
Trp |
Tyr |
|---|---|---|---|---|---|---|---|---|---|
2.812 ± 0.018 | 4.809 ± 0.031 |
3.509 ± 0.026 | 4.042 ± 0.031 |
3.761 ± 0.026 | 6.208 ± 0.028 |
5.494 ± 0.026 | 6.832 ± 0.036 |
1.014 ± 0.016 | 3.623 ± 0.026 |
Most of the basic statistics you can see at this page can be downloaded from this CSV file
Proteome-pI is available under Creative Commons Attribution-NoDerivs license, for more details see here
| Reference: Kozlowski LP. Proteome-pI 2.0: Proteome Isoelectric Point Database Update. Nucleic Acids Res. 2021, doi: 10.1093/nar/gkab944 | Contact: Lukasz P. Kozlowski |
