Cytophaga hutchinsonii (strain ATCC 33406 / DSM 1761 / CIP 103989 / NBRC 15051 / NCIMB 9469 / D465)
Taxonomy: cellular organisms; Bacteria; FCB group; Bacteroidetes/Chlorobi group; Bacteroidetes; Cytophagia; Cytophagales; Cytophagaceae; Cytophaga; Cytophaga hutchinsonii
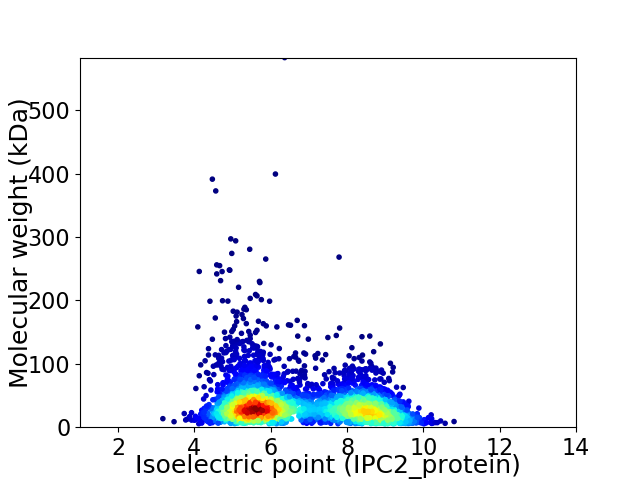
Average proteome isoelectric point is 6.7
Get precalculated fractions of proteins

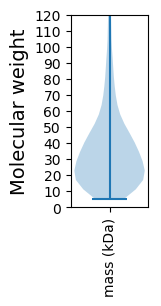
Virtual 2D-PAGE plot for 3771 proteins (isoelectric point calculated using IPC2_protein)
Get csv file with sequences according to given criteria:
* You can choose from 21 different methods for calculating isoelectric point
Summary statistics related to proteome-wise predictions


Protein with the lowest isoelectric point:
>tr|A0A6N4SRP6|A0A6N4SRP6_CYTH3 Isochorismate synthase OS=Cytophaga hutchinsonii (strain ATCC 33406 / DSM 1761 / CIP 103989 / NBRC 15051 / NCIMB 9469 / D465) OX=269798 GN=entC PE=4 SV=1
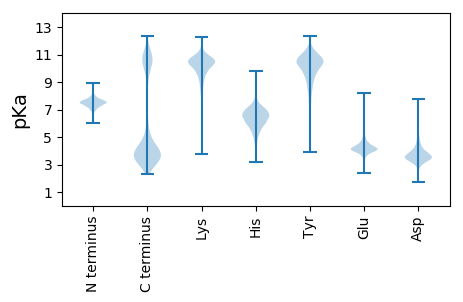
MM1 pKa = 7.9IIQDD5 pKa = 4.37YY6 pKa = 10.19IDD8 pKa = 3.57YY9 pKa = 10.26WNEE12 pKa = 3.2QDD14 pKa = 5.4IEE16 pKa = 4.13LDD18 pKa = 3.76KK19 pKa = 11.28IKK21 pKa = 10.78LEE23 pKa = 4.26SVHH26 pKa = 7.08AIPLPVDD33 pKa = 2.9ILEE36 pKa = 4.28FLSMVGLPKK45 pKa = 10.17EE46 pKa = 3.96AAPYY50 pKa = 8.76LTFNITSFPAFVSPDD65 pKa = 3.55DD66 pKa = 5.44LYY68 pKa = 11.63DD69 pKa = 4.64LEE71 pKa = 5.31DD72 pKa = 5.16RR73 pKa = 11.84PDD75 pKa = 3.52LSDD78 pKa = 2.94WFIIGEE84 pKa = 4.43TGNSDD89 pKa = 4.91PICIDD94 pKa = 2.83PMGGYY99 pKa = 9.67RR100 pKa = 11.84ICYY103 pKa = 9.55VEE105 pKa = 4.31TEE107 pKa = 4.24NEE109 pKa = 3.87FNAVFMNSSLDD120 pKa = 3.4KK121 pKa = 11.0LAICIYY127 pKa = 10.0LYY129 pKa = 10.96EE130 pKa = 4.35KK131 pKa = 10.48FIEE134 pKa = 4.36KK135 pKa = 10.39FSTEE139 pKa = 3.65EE140 pKa = 4.03SEE142 pKa = 4.59NLVFNDD148 pKa = 4.86ADD150 pKa = 3.38WEE152 pKa = 4.28YY153 pKa = 11.44LKK155 pKa = 10.89KK156 pKa = 10.52QFMDD160 pKa = 3.61IDD162 pKa = 4.05PEE164 pKa = 4.23ALSEE168 pKa = 4.29GSFWDD173 pKa = 3.91YY174 pKa = 11.01YY175 pKa = 11.39LEE177 pKa = 4.12YY178 pKa = 11.13LLVDD182 pKa = 4.03RR183 pKa = 11.84DD184 pKa = 3.6
MM1 pKa = 7.9IIQDD5 pKa = 4.37YY6 pKa = 10.19IDD8 pKa = 3.57YY9 pKa = 10.26WNEE12 pKa = 3.2QDD14 pKa = 5.4IEE16 pKa = 4.13LDD18 pKa = 3.76KK19 pKa = 11.28IKK21 pKa = 10.78LEE23 pKa = 4.26SVHH26 pKa = 7.08AIPLPVDD33 pKa = 2.9ILEE36 pKa = 4.28FLSMVGLPKK45 pKa = 10.17EE46 pKa = 3.96AAPYY50 pKa = 8.76LTFNITSFPAFVSPDD65 pKa = 3.55DD66 pKa = 5.44LYY68 pKa = 11.63DD69 pKa = 4.64LEE71 pKa = 5.31DD72 pKa = 5.16RR73 pKa = 11.84PDD75 pKa = 3.52LSDD78 pKa = 2.94WFIIGEE84 pKa = 4.43TGNSDD89 pKa = 4.91PICIDD94 pKa = 2.83PMGGYY99 pKa = 9.67RR100 pKa = 11.84ICYY103 pKa = 9.55VEE105 pKa = 4.31TEE107 pKa = 4.24NEE109 pKa = 3.87FNAVFMNSSLDD120 pKa = 3.4KK121 pKa = 11.0LAICIYY127 pKa = 10.0LYY129 pKa = 10.96EE130 pKa = 4.35KK131 pKa = 10.48FIEE134 pKa = 4.36KK135 pKa = 10.39FSTEE139 pKa = 3.65EE140 pKa = 4.03SEE142 pKa = 4.59NLVFNDD148 pKa = 4.86ADD150 pKa = 3.38WEE152 pKa = 4.28YY153 pKa = 11.44LKK155 pKa = 10.89KK156 pKa = 10.52QFMDD160 pKa = 3.61IDD162 pKa = 4.05PEE164 pKa = 4.23ALSEE168 pKa = 4.29GSFWDD173 pKa = 3.91YY174 pKa = 11.01YY175 pKa = 11.39LEE177 pKa = 4.12YY178 pKa = 11.13LLVDD182 pKa = 4.03RR183 pKa = 11.84DD184 pKa = 3.6
Molecular weight: 21.55 kDa
Isoelectric point according different methods:
Protein with the highest isoelectric point:
>tr|A0A6N4SQ95|A0A6N4SQ95_CYTH3 HTH cro/C1-type domain-containing protein OS=Cytophaga hutchinsonii (strain ATCC 33406 / DSM 1761 / CIP 103989 / NBRC 15051 / NCIMB 9469 / D465) OX=269798 GN=CHU_1178 PE=4 SV=1
MM1 pKa = 8.03RR2 pKa = 11.84IFLTEE7 pKa = 3.89QPCWITATPAGGTTGKK23 pKa = 9.86SLCATTDD30 pKa = 2.21IFMYY34 pKa = 9.43LTFSKK39 pKa = 9.25NTLSIFPQPFTQNVVLSLKK58 pKa = 10.36NNPINPLLFSICRR71 pKa = 11.84VFNRR75 pKa = 11.84IPSRR79 pKa = 11.84YY80 pKa = 7.66RR81 pKa = 11.84HH82 pKa = 5.9LRR84 pKa = 11.84NTIRR88 pKa = 11.84GIFTT92 pKa = 3.62
MM1 pKa = 8.03RR2 pKa = 11.84IFLTEE7 pKa = 3.89QPCWITATPAGGTTGKK23 pKa = 9.86SLCATTDD30 pKa = 2.21IFMYY34 pKa = 9.43LTFSKK39 pKa = 9.25NTLSIFPQPFTQNVVLSLKK58 pKa = 10.36NNPINPLLFSICRR71 pKa = 11.84VFNRR75 pKa = 11.84IPSRR79 pKa = 11.84YY80 pKa = 7.66RR81 pKa = 11.84HH82 pKa = 5.9LRR84 pKa = 11.84NTIRR88 pKa = 11.84GIFTT92 pKa = 3.62
Molecular weight: 10.51 kDa
Isoelectric point according different methods:
Peptides (in silico digests for buttom-up proteomics)
Below you can find in silico digests of the whole proteome with Trypsin, Chymotrypsin, Trypsin+LysC, LysN, ArgC proteases suitable for different mass spec machines.| Try ESI |
 |
|---|
| ChTry ESI |
 |
|---|
| ArgC ESI |
 |
|---|
| LysN ESI |
 |
|---|
| TryLysC ESI |
 |
|---|
| Try MALDI |
 |
|---|
| ChTry MALDI |
 |
|---|
| ArgC MALDI |
 |
|---|
| LysN MALDI |
 |
|---|
| TryLysC MALDI |
 |
|---|
| Try LTQ |
 |
|---|
| ChTry LTQ |
 |
|---|
| ArgC LTQ |
 |
|---|
| LysN LTQ |
 |
|---|
| TryLysC LTQ |
 |
|---|
| Try MSlow |
 |
|---|
| ChTry MSlow |
 |
|---|
| ArgC MSlow |
 |
|---|
| LysN MSlow |
 |
|---|
| TryLysC MSlow |
 |
|---|
| Try MShigh |
 |
|---|
| ChTry MShigh |
 |
|---|
| ArgC MShigh |
 |
|---|
| LysN MShigh |
 |
|---|
| TryLysC MShigh |
 |
|---|
General Statistics
Number of major isoforms |
Number of additional isoforms |
Number of all proteins |
Number of amino acids |
Min. Seq. Length |
Max. Seq. Length |
Avg. Seq. Length |
Avg. Mol. Weight |
|---|---|---|---|---|---|---|---|
0 |
1325175 |
49 |
5453 |
351.4 |
39.33 |
Amino acid frequency
Ala |
Cys |
Asp |
Glu |
Phe |
Gly |
His |
Ile |
Lys |
Leu |
|---|---|---|---|---|---|---|---|---|---|
7.259 ± 0.053 | 1.045 ± 0.016 |
5.069 ± 0.029 | 5.643 ± 0.058 |
4.912 ± 0.037 | 6.433 ± 0.048 |
1.865 ± 0.025 | 7.868 ± 0.043 |
6.981 ± 0.062 | 9.089 ± 0.061 |
Met |
Asn |
Gln |
Pro |
Arg |
Ser |
Thr |
Val |
Trp |
Tyr |
|---|---|---|---|---|---|---|---|---|---|
2.236 ± 0.025 | 5.559 ± 0.042 |
3.641 ± 0.027 | 3.459 ± 0.022 |
3.352 ± 0.032 | 6.869 ± 0.045 |
6.739 ± 0.107 | 6.469 ± 0.033 |
1.084 ± 0.013 | 4.428 ± 0.035 |
Most of the basic statistics you can see at this page can be downloaded from this CSV file
Proteome-pI is available under Creative Commons Attribution-NoDerivs license, for more details see here
| Reference: Kozlowski LP. Proteome-pI 2.0: Proteome Isoelectric Point Database Update. Nucleic Acids Res. 2021, doi: 10.1093/nar/gkab944 | Contact: Lukasz P. Kozlowski |
