Arthrobacter phage Maureen
Taxonomy: Viruses; Duplodnaviria; Heunggongvirae; Uroviricota; Caudoviricetes; Caudovirales; Siphoviridae; Liebevirus; unclassified Liebevirus
Average proteome isoelectric point is 6.33
Get precalculated fractions of proteins
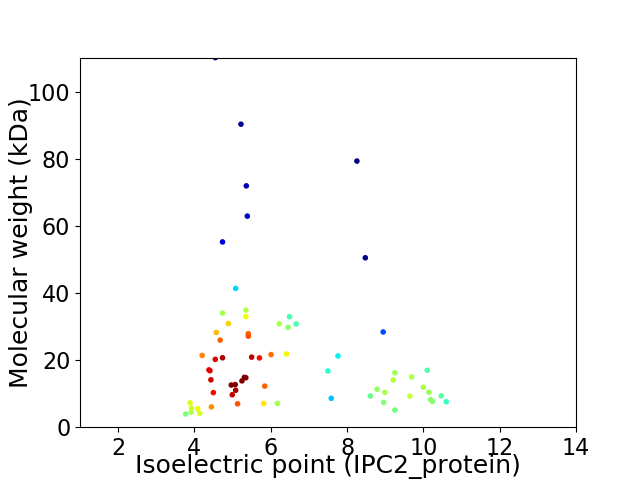
Virtual 2D-PAGE plot for 69 proteins (isoelectric point calculated using IPC2_protein)
Get csv file with sequences according to given criteria:
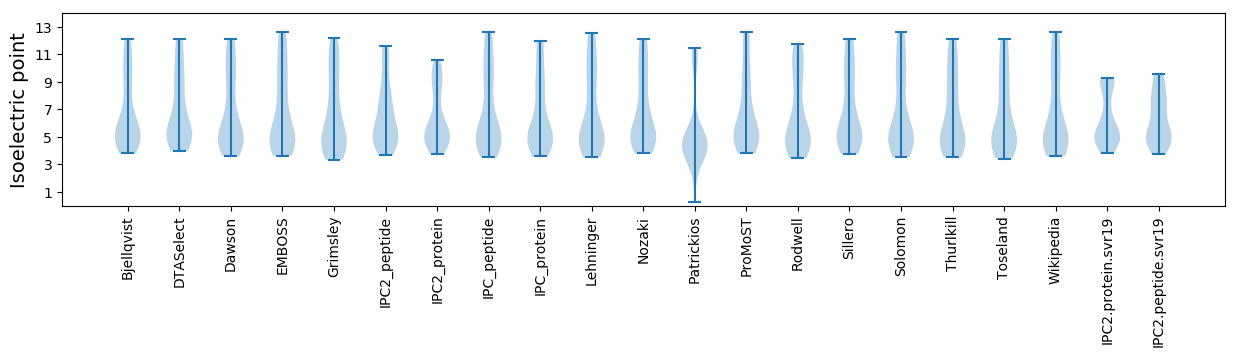
* You can choose from 21 different methods for calculating isoelectric point
Summary statistics related to proteome-wise predictions
Protein with the lowest isoelectric point:
>tr|A0A3G2KHP4|A0A3G2KHP4_9CAUD Head-to-tail adaptor OS=Arthrobacter phage Maureen OX=2419961 GN=7 PE=4 SV=1
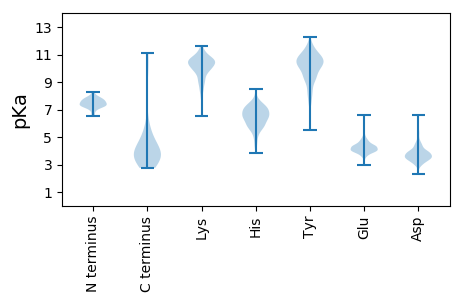
MM1 pKa = 7.25LHH3 pKa = 7.34DD4 pKa = 3.97VDD6 pKa = 4.07QTPVFATLCLEE17 pKa = 4.2YY18 pKa = 10.1PDD20 pKa = 5.67LVWDD24 pKa = 3.8QPYY27 pKa = 10.1VEE29 pKa = 4.26ARR31 pKa = 11.84SWDD34 pKa = 3.52GATVRR39 pKa = 11.84VVPAGPLTTLL49 pKa = 3.77
MM1 pKa = 7.25LHH3 pKa = 7.34DD4 pKa = 3.97VDD6 pKa = 4.07QTPVFATLCLEE17 pKa = 4.2YY18 pKa = 10.1PDD20 pKa = 5.67LVWDD24 pKa = 3.8QPYY27 pKa = 10.1VEE29 pKa = 4.26ARR31 pKa = 11.84SWDD34 pKa = 3.52GATVRR39 pKa = 11.84VVPAGPLTTLL49 pKa = 3.77
Molecular weight: 5.49 kDa
Isoelectric point according different methods:
Protein with the highest isoelectric point:
>tr|A0A3G2KHU0|A0A3G2KHU0_9CAUD Uncharacterized protein OS=Arthrobacter phage Maureen OX=2419961 GN=57 PE=4 SV=1
MM1 pKa = 7.4LADD4 pKa = 4.22LALFAWACVAWAAIILAPCWAVAVLDD30 pKa = 3.46GWIRR34 pKa = 11.84KK35 pKa = 8.62RR36 pKa = 11.84RR37 pKa = 11.84AARR40 pKa = 11.84RR41 pKa = 11.84DD42 pKa = 3.21RR43 pKa = 11.84MLL45 pKa = 5.0
MM1 pKa = 7.4LADD4 pKa = 4.22LALFAWACVAWAAIILAPCWAVAVLDD30 pKa = 3.46GWIRR34 pKa = 11.84KK35 pKa = 8.62RR36 pKa = 11.84RR37 pKa = 11.84AARR40 pKa = 11.84RR41 pKa = 11.84DD42 pKa = 3.21RR43 pKa = 11.84MLL45 pKa = 5.0
Molecular weight: 5.11 kDa
Isoelectric point according different methods:
Peptides (in silico digests for buttom-up proteomics)
Below you can find in silico digests of the whole proteome with Trypsin, Chymotrypsin, Trypsin+LysC, LysN, ArgC proteases suitable for different mass spec machines.| Try ESI |
 |
|---|
| ChTry ESI |
|
|---|
| ArgC ESI |
|
|---|
| LysN ESI |
|
|---|
| TryLysC ESI |
|
|---|
| Try MALDI |
|
|---|
| ChTry MALDI |
|
|---|
| ArgC MALDI |
|
|---|
| LysN MALDI |
|
|---|
| TryLysC MALDI |
|
|---|
| Try LTQ |
|
|---|
| ChTry LTQ |
|
|---|
| ArgC LTQ |
|
|---|
| LysN LTQ |
|
|---|
| TryLysC LTQ |
|
|---|
| Try MSlow |
|
|---|
| ChTry MSlow |
|
|---|
| ArgC MSlow |
|
|---|
| LysN MSlow |
|
|---|
| TryLysC MSlow |
|
|---|
| Try MShigh |
|
|---|
| ChTry MShigh |
|
|---|
| ArgC MShigh |
|
|---|
| LysN MShigh |
|
|---|
| TryLysC MShigh |
|
|---|
General Statistics
Number of major isoforms |
Number of additional isoforms |
Number of all proteins |
Number of amino acids |
Min. Seq. Length |
Max. Seq. Length |
Avg. Seq. Length |
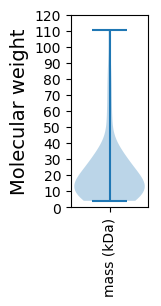
Avg. Mol. Weight |
|---|---|---|---|---|---|---|---|
0 |
14338 |
36 |
1076 |
207.8 |
22.33 |
Amino acid frequency
Ala |
Cys |
Asp |
Glu |
Phe |
Gly |
His |
Ile |
Lys |
Leu |
|---|---|---|---|---|---|---|---|---|---|
14.612 ± 0.561 | 0.572 ± 0.106 |
7.421 ± 0.33 | 5.05 ± 0.328 |
2.832 ± 0.18 | 8.683 ± 0.356 |
1.527 ± 0.151 | 3.641 ± 0.275 |
3.341 ± 0.194 | 8.579 ± 0.281 |
Met |
Asn |
Gln |
Pro |
Arg |
Ser |
Thr |
Val |
Trp |
Tyr |
|---|---|---|---|---|---|---|---|---|---|
1.632 ± 0.1 | 1.848 ± 0.224 |
5.447 ± 0.277 | 2.622 ± 0.133 |
7.923 ± 0.571 | 5.259 ± 0.27 |
6.34 ± 0.366 | 8.321 ± 0.302 |
1.806 ± 0.128 | 2.546 ± 0.169 |
Most of the basic statistics you can see at this page can be downloaded from this CSV file
See this proteome in:

Proteome-pI is available under Creative Commons Attribution-NoDerivs license, for more details see here
| Reference: Kozlowski LP. Proteome-pI 2.0: Proteome Isoelectric Point Database Update. Nucleic Acids Res. 2021, doi: 10.1093/nar/gkab944 | Contact: Lukasz P. Kozlowski |