Rotavirus J
Taxonomy: Viruses; Riboviria; Orthornavirae; Duplornaviricota; Resentoviricetes; Reovirales; Reoviridae; Sedoreovirinae; Rotavirus
Average proteome isoelectric point is 6.67
Get precalculated fractions of proteins

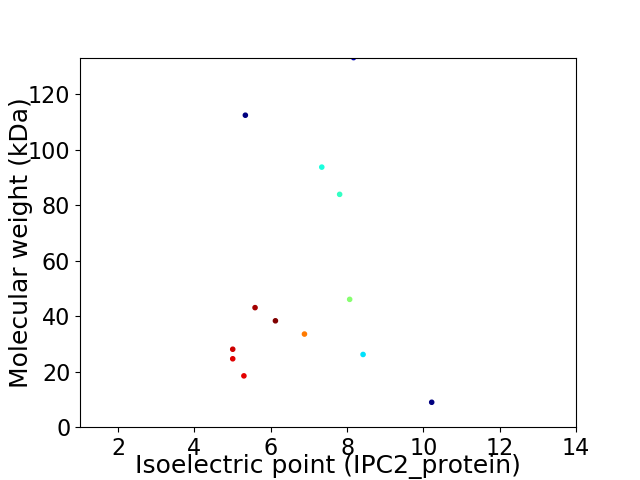
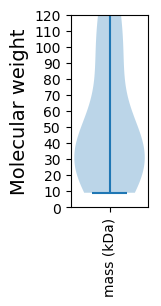
Virtual 2D-PAGE plot for 13 proteins (isoelectric point calculated using IPC2_protein)
Get csv file with sequences according to given criteria:
* You can choose from 21 different methods for calculating isoelectric point
Summary statistics related to proteome-wise predictions


Protein with the lowest isoelectric point:
>tr|A0A1L6BXM0|A0A1L6BXM0_9REOV ORF-X OS=Rotavirus J OX=1929964 GN=ORF-X PE=4 SV=1
MM1 pKa = 7.94LSMALFLLALLSITEE16 pKa = 3.76ARR18 pKa = 11.84INVGFVSPDD27 pKa = 3.07VCIVAEE33 pKa = 4.33RR34 pKa = 11.84QTSDD38 pKa = 2.9ADD40 pKa = 3.96KK41 pKa = 11.03INNLLDD47 pKa = 4.28FYY49 pKa = 10.6SFRR52 pKa = 11.84GFTYY56 pKa = 8.95EE57 pKa = 3.37ICQFNQDD64 pKa = 3.68ADD66 pKa = 4.39AIDD69 pKa = 5.27AISKK73 pKa = 9.08CSCLYY78 pKa = 11.03GNNTQIVAYY87 pKa = 9.64ADD89 pKa = 3.77TVKK92 pKa = 10.97SDD94 pKa = 3.32LATLLGNDD102 pKa = 3.6NDD104 pKa = 4.03CTVFTKK110 pKa = 9.08KK111 pKa = 8.33TKK113 pKa = 10.09KK114 pKa = 9.42WIPQYY119 pKa = 11.28DD120 pKa = 3.54RR121 pKa = 11.84DD122 pKa = 4.07RR123 pKa = 11.84EE124 pKa = 4.12YY125 pKa = 11.15FLYY128 pKa = 10.55AKK130 pKa = 9.92NVRR133 pKa = 11.84ICYY136 pKa = 9.78ISEE139 pKa = 3.97SLLGMGCDD147 pKa = 3.93STKK150 pKa = 10.39EE151 pKa = 4.02WTWQNITSTDD161 pKa = 3.55YY162 pKa = 11.4AIADD166 pKa = 3.91IPEE169 pKa = 3.97MTLDD173 pKa = 3.99GFWLFTTEE181 pKa = 3.6TAYY184 pKa = 11.25LCVRR188 pKa = 11.84KK189 pKa = 10.14DD190 pKa = 3.32SSQPKK195 pKa = 9.53PIYY198 pKa = 10.06FFNLIGNKK206 pKa = 9.61PPEE209 pKa = 4.26DD210 pKa = 3.38QIGQTRR216 pKa = 11.84SLATAWKK223 pKa = 8.86AVNSILHH230 pKa = 5.85FVYY233 pKa = 10.26KK234 pKa = 10.61VLDD237 pKa = 3.1IFYY240 pKa = 10.45RR241 pKa = 11.84EE242 pKa = 3.93RR243 pKa = 11.84LRR245 pKa = 4.8
MM1 pKa = 7.94LSMALFLLALLSITEE16 pKa = 3.76ARR18 pKa = 11.84INVGFVSPDD27 pKa = 3.07VCIVAEE33 pKa = 4.33RR34 pKa = 11.84QTSDD38 pKa = 2.9ADD40 pKa = 3.96KK41 pKa = 11.03INNLLDD47 pKa = 4.28FYY49 pKa = 10.6SFRR52 pKa = 11.84GFTYY56 pKa = 8.95EE57 pKa = 3.37ICQFNQDD64 pKa = 3.68ADD66 pKa = 4.39AIDD69 pKa = 5.27AISKK73 pKa = 9.08CSCLYY78 pKa = 11.03GNNTQIVAYY87 pKa = 9.64ADD89 pKa = 3.77TVKK92 pKa = 10.97SDD94 pKa = 3.32LATLLGNDD102 pKa = 3.6NDD104 pKa = 4.03CTVFTKK110 pKa = 9.08KK111 pKa = 8.33TKK113 pKa = 10.09KK114 pKa = 9.42WIPQYY119 pKa = 11.28DD120 pKa = 3.54RR121 pKa = 11.84DD122 pKa = 4.07RR123 pKa = 11.84EE124 pKa = 4.12YY125 pKa = 11.15FLYY128 pKa = 10.55AKK130 pKa = 9.92NVRR133 pKa = 11.84ICYY136 pKa = 9.78ISEE139 pKa = 3.97SLLGMGCDD147 pKa = 3.93STKK150 pKa = 10.39EE151 pKa = 4.02WTWQNITSTDD161 pKa = 3.55YY162 pKa = 11.4AIADD166 pKa = 3.91IPEE169 pKa = 3.97MTLDD173 pKa = 3.99GFWLFTTEE181 pKa = 3.6TAYY184 pKa = 11.25LCVRR188 pKa = 11.84KK189 pKa = 10.14DD190 pKa = 3.32SSQPKK195 pKa = 9.53PIYY198 pKa = 10.06FFNLIGNKK206 pKa = 9.61PPEE209 pKa = 4.26DD210 pKa = 3.38QIGQTRR216 pKa = 11.84SLATAWKK223 pKa = 8.86AVNSILHH230 pKa = 5.85FVYY233 pKa = 10.26KK234 pKa = 10.61VLDD237 pKa = 3.1IFYY240 pKa = 10.45RR241 pKa = 11.84EE242 pKa = 3.93RR243 pKa = 11.84LRR245 pKa = 4.8
Molecular weight: 28.09 kDa
Isoelectric point according different methods:
Protein with the highest isoelectric point:
>tr|A0A1L6BXK9|A0A1L6BXK9_9REOV VP3 OS=Rotavirus J OX=1929964 GN=VP3 PE=4 SV=1
MM1 pKa = 7.94KK2 pKa = 8.91DD3 pKa = 3.17TQKK6 pKa = 11.44LMTIFQEE13 pKa = 4.65SSQHH17 pKa = 4.67QSQNLSILQKK27 pKa = 9.39ISRR30 pKa = 11.84MLRR33 pKa = 11.84LLRR36 pKa = 11.84RR37 pKa = 11.84NARR40 pKa = 11.84RR41 pKa = 11.84QRR43 pKa = 11.84YY44 pKa = 4.8YY45 pKa = 10.64QRR47 pKa = 11.84YY48 pKa = 8.37KK49 pKa = 9.85SRR51 pKa = 11.84LYY53 pKa = 10.47KK54 pKa = 10.44VEE56 pKa = 4.08TMGSNINSHH65 pKa = 6.06SSNFDD70 pKa = 2.75WKK72 pKa = 10.76KK73 pKa = 10.69
MM1 pKa = 7.94KK2 pKa = 8.91DD3 pKa = 3.17TQKK6 pKa = 11.44LMTIFQEE13 pKa = 4.65SSQHH17 pKa = 4.67QSQNLSILQKK27 pKa = 9.39ISRR30 pKa = 11.84MLRR33 pKa = 11.84LLRR36 pKa = 11.84RR37 pKa = 11.84NARR40 pKa = 11.84RR41 pKa = 11.84QRR43 pKa = 11.84YY44 pKa = 4.8YY45 pKa = 10.64QRR47 pKa = 11.84YY48 pKa = 8.37KK49 pKa = 9.85SRR51 pKa = 11.84LYY53 pKa = 10.47KK54 pKa = 10.44VEE56 pKa = 4.08TMGSNINSHH65 pKa = 6.06SSNFDD70 pKa = 2.75WKK72 pKa = 10.76KK73 pKa = 10.69
Molecular weight: 8.98 kDa
Isoelectric point according different methods:
Peptides (in silico digests for buttom-up proteomics)
Below you can find in silico digests of the whole proteome with Trypsin, Chymotrypsin, Trypsin+LysC, LysN, ArgC proteases suitable for different mass spec machines.| Try ESI |
 |
|---|
| ChTry ESI |
 |
|---|
| ArgC ESI |
 |
|---|
| LysN ESI |
 |
|---|
| TryLysC ESI |
 |
|---|
| Try MALDI |
 |
|---|
| ChTry MALDI |
 |
|---|
| ArgC MALDI |
 |
|---|
| LysN MALDI |
 |
|---|
| TryLysC MALDI |
 |
|---|
| Try LTQ |
 |
|---|
| ChTry LTQ |
 |
|---|
| ArgC LTQ |
 |
|---|
| LysN LTQ |
 |
|---|
| TryLysC LTQ |
 |
|---|
| Try MSlow |
 |
|---|
| ChTry MSlow |
 |
|---|
| ArgC MSlow |
 |
|---|
| LysN MSlow |
 |
|---|
| TryLysC MSlow |
 |
|---|
| Try MShigh |
 |
|---|
| ChTry MShigh |
 |
|---|
| ArgC MShigh |
 |
|---|
| LysN MShigh |
 |
|---|
| TryLysC MShigh |
 |
|---|
General Statistics
Number of major isoforms |
Number of additional isoforms |
Number of all proteins |
Number of amino acids |
Min. Seq. Length |
Max. Seq. Length |
Avg. Seq. Length |
Avg. Mol. Weight |
|---|---|---|---|---|---|---|---|
0 |
6037 |
73 |
1168 |
464.4 |
53.12 |
Amino acid frequency
Ala |
Cys |
Asp |
Glu |
Phe |
Gly |
His |
Ile |
Lys |
Leu |
|---|---|---|---|---|---|---|---|---|---|
6.41 ± 0.575 | 0.994 ± 0.26 |
5.996 ± 0.431 | 6.377 ± 0.425 |
4.174 ± 0.235 | 3.975 ± 0.387 |
1.706 ± 0.266 | 7.603 ± 0.413 |
6.907 ± 0.747 | 9.028 ± 0.69 |
Met |
Asn |
Gln |
Pro |
Arg |
Ser |
Thr |
Val |
Trp |
Tyr |
|---|---|---|---|---|---|---|---|---|---|
2.7 ± 0.247 | 6.212 ± 0.473 |
3.843 ± 0.276 | 4.406 ± 0.517 |
5.665 ± 0.404 | 7.156 ± 0.6 |
6.245 ± 0.45 | 5.814 ± 0.425 |
0.994 ± 0.146 | 3.793 ± 0.383 |
Most of the basic statistics you can see at this page can be downloaded from this CSV file
Proteome-pI is available under Creative Commons Attribution-NoDerivs license, for more details see here
| Reference: Kozlowski LP. Proteome-pI 2.0: Proteome Isoelectric Point Database Update. Nucleic Acids Res. 2021, doi: 10.1093/nar/gkab944 | Contact: Lukasz P. Kozlowski |
