Micromonospora olivasterospora
Taxonomy: cellular organisms; Bacteria; Terrabacteria group; Actinobacteria; Actinomycetia; Micromonosporales; Micromonosporaceae; Micromo
Average proteome isoelectric point is 6.84
Get precalculated fractions of proteins

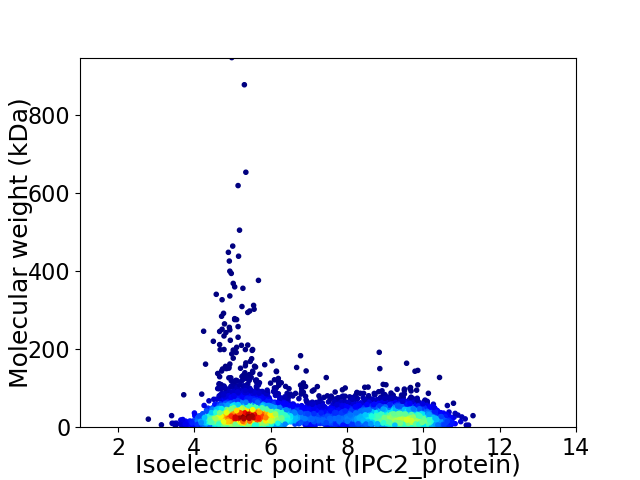
Virtual 2D-PAGE plot for 6202 proteins (isoelectric point calculated using IPC2_protein)
Get csv file with sequences according to given criteria:
* You can choose from 21 different methods for calculating isoelectric point
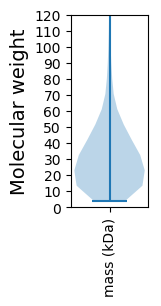
Summary statistics related to proteome-wise predictions


Protein with the lowest isoelectric point:
>tr|A0A562IHQ9|A0A562IHQ9_MICOL Uncharacterized protein OS=Micromonospora olivasterospora OX=1880 GN=JD77_05381 PE=4 SV=1
MM1 pKa = 7.73IDD3 pKa = 3.83DD4 pKa = 5.42GYY6 pKa = 11.45FGDD9 pKa = 4.49EE10 pKa = 3.67VAARR14 pKa = 11.84YY15 pKa = 8.59DD16 pKa = 3.76DD17 pKa = 3.96PTSEE21 pKa = 3.92MFAPNVVGATVDD33 pKa = 3.52VLAEE37 pKa = 4.0LAGPWSWASAPDD49 pKa = 3.58ASRR52 pKa = 11.84CRR54 pKa = 11.84SPAAAYY60 pKa = 10.15LVFNTIMNLTTT71 pKa = 3.75
MM1 pKa = 7.73IDD3 pKa = 3.83DD4 pKa = 5.42GYY6 pKa = 11.45FGDD9 pKa = 4.49EE10 pKa = 3.67VAARR14 pKa = 11.84YY15 pKa = 8.59DD16 pKa = 3.76DD17 pKa = 3.96PTSEE21 pKa = 3.92MFAPNVVGATVDD33 pKa = 3.52VLAEE37 pKa = 4.0LAGPWSWASAPDD49 pKa = 3.58ASRR52 pKa = 11.84CRR54 pKa = 11.84SPAAAYY60 pKa = 10.15LVFNTIMNLTTT71 pKa = 3.75
Molecular weight: 7.6 kDa
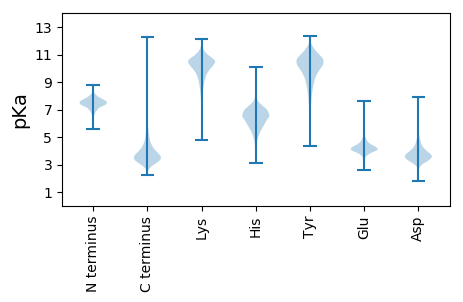
Isoelectric point according different methods:
Protein with the highest isoelectric point:
>tr|A0A562I6M7|A0A562I6M7_MICOL Serine protease OS=Micromonospora olivasterospora OX=1880 GN=JD77_01635 PE=3 SV=1
MM1 pKa = 7.47TSPMPPPSAWPAPSTWPAAAARR23 pKa = 11.84STAAAPTTGAPAGWPRR39 pKa = 11.84PSASRR44 pKa = 11.84CPTPPPSRR52 pKa = 11.84SRR54 pKa = 11.84PPMSPMSGMPPGPPTRR70 pKa = 11.84RR71 pKa = 11.84RR72 pKa = 11.84TTGRR76 pKa = 11.84RR77 pKa = 11.84APAGAGAARR86 pKa = 11.84RR87 pKa = 11.84AARR90 pKa = 11.84PTPPRR95 pKa = 11.84PTGTGQRR102 pKa = 11.84PRR104 pKa = 11.84THH106 pKa = 6.78RR107 pKa = 11.84PPRR110 pKa = 11.84RR111 pKa = 11.84GWPLRR116 pKa = 11.84SRR118 pKa = 11.84GRR120 pKa = 11.84RR121 pKa = 11.84RR122 pKa = 11.84VPPSNRR128 pKa = 11.84PRR130 pKa = 11.84SRR132 pKa = 11.84GRR134 pKa = 11.84KK135 pKa = 7.16PHH137 pKa = 6.64PLPGRR142 pKa = 11.84KK143 pKa = 8.83RR144 pKa = 11.84LRR146 pKa = 11.84PRR148 pKa = 11.84ASRR151 pKa = 11.84RR152 pKa = 11.84LPPCGTSRR160 pKa = 11.84LRR162 pKa = 11.84PCGTSRR168 pKa = 11.84SRR170 pKa = 11.84SRR172 pKa = 11.84GVGRR176 pKa = 11.84TPASRR181 pKa = 11.84PPRR184 pKa = 11.84GRR186 pKa = 11.84SGPGSRR192 pKa = 11.84RR193 pKa = 11.84TPPRR197 pKa = 11.84PVRR200 pKa = 11.84LAPAQPWRR208 pKa = 11.84IRR210 pKa = 11.84PPPTRR215 pKa = 11.84PAPTRR220 pKa = 11.84PGRR223 pKa = 11.84APRR226 pKa = 11.84WPTRR230 pKa = 11.84PPPCRR235 pKa = 11.84RR236 pKa = 11.84AVRR239 pKa = 11.84PVGAAPASGRR249 pKa = 11.84AGPQPTPPRR258 pKa = 11.84PPGRR262 pKa = 11.84TPARR266 pKa = 11.84ARR268 pKa = 11.84PARR271 pKa = 11.84RR272 pKa = 11.84PRR274 pKa = 3.62
MM1 pKa = 7.47TSPMPPPSAWPAPSTWPAAAARR23 pKa = 11.84STAAAPTTGAPAGWPRR39 pKa = 11.84PSASRR44 pKa = 11.84CPTPPPSRR52 pKa = 11.84SRR54 pKa = 11.84PPMSPMSGMPPGPPTRR70 pKa = 11.84RR71 pKa = 11.84RR72 pKa = 11.84TTGRR76 pKa = 11.84RR77 pKa = 11.84APAGAGAARR86 pKa = 11.84RR87 pKa = 11.84AARR90 pKa = 11.84PTPPRR95 pKa = 11.84PTGTGQRR102 pKa = 11.84PRR104 pKa = 11.84THH106 pKa = 6.78RR107 pKa = 11.84PPRR110 pKa = 11.84RR111 pKa = 11.84GWPLRR116 pKa = 11.84SRR118 pKa = 11.84GRR120 pKa = 11.84RR121 pKa = 11.84RR122 pKa = 11.84VPPSNRR128 pKa = 11.84PRR130 pKa = 11.84SRR132 pKa = 11.84GRR134 pKa = 11.84KK135 pKa = 7.16PHH137 pKa = 6.64PLPGRR142 pKa = 11.84KK143 pKa = 8.83RR144 pKa = 11.84LRR146 pKa = 11.84PRR148 pKa = 11.84ASRR151 pKa = 11.84RR152 pKa = 11.84LPPCGTSRR160 pKa = 11.84LRR162 pKa = 11.84PCGTSRR168 pKa = 11.84SRR170 pKa = 11.84SRR172 pKa = 11.84GVGRR176 pKa = 11.84TPASRR181 pKa = 11.84PPRR184 pKa = 11.84GRR186 pKa = 11.84SGPGSRR192 pKa = 11.84RR193 pKa = 11.84TPPRR197 pKa = 11.84PVRR200 pKa = 11.84LAPAQPWRR208 pKa = 11.84IRR210 pKa = 11.84PPPTRR215 pKa = 11.84PAPTRR220 pKa = 11.84PGRR223 pKa = 11.84APRR226 pKa = 11.84WPTRR230 pKa = 11.84PPPCRR235 pKa = 11.84RR236 pKa = 11.84AVRR239 pKa = 11.84PVGAAPASGRR249 pKa = 11.84AGPQPTPPRR258 pKa = 11.84PPGRR262 pKa = 11.84TPARR266 pKa = 11.84ARR268 pKa = 11.84PARR271 pKa = 11.84RR272 pKa = 11.84PRR274 pKa = 3.62
Molecular weight: 29.58 kDa
Isoelectric point according different methods:
Peptides (in silico digests for buttom-up proteomics)
Below you can find in silico digests of the whole proteome with Trypsin, Chymotrypsin, Trypsin+LysC, LysN, ArgC proteases suitable for different mass spec machines.| Try ESI |
 |
|---|
| ChTry ESI |
 |
|---|
| ArgC ESI |
 |
|---|
| LysN ESI |
 |
|---|
| TryLysC ESI |
 |
|---|
| Try MALDI |
 |
|---|
| ChTry MALDI |
 |
|---|
| ArgC MALDI |
 |
|---|
| LysN MALDI |
 |
|---|
| TryLysC MALDI |
 |
|---|
| Try LTQ |
 |
|---|
| ChTry LTQ |
 |
|---|
| ArgC LTQ |
 |
|---|
| LysN LTQ |
 |
|---|
| TryLysC LTQ |
 |
|---|
| Try MSlow |
 |
|---|
| ChTry MSlow |
 |
|---|
| ArgC MSlow |
 |
|---|
| LysN MSlow |
 |
|---|
| TryLysC MSlow |
 |
|---|
| Try MShigh |
 |
|---|
| ChTry MShigh |
 |
|---|
| ArgC MShigh |
 |
|---|
| LysN MShigh |
 |
|---|
| TryLysC MShigh |
 |
|---|
General Statistics
Number of major isoforms |
Number of additional isoforms |
Number of all proteins |
Number of amino acids |
Min. Seq. Length |
Max. Seq. Length |
Avg. Seq. Length |
Avg. Mol. Weight |
|---|---|---|---|---|---|---|---|
0 |
2002684 |
39 |
8903 |
322.9 |
34.51 |
Amino acid frequency
Ala |
Cys |
Asp |
Glu |
Phe |
Gly |
His |
Ile |
Lys |
Leu |
|---|---|---|---|---|---|---|---|---|---|
14.171 ± 0.063 | 0.774 ± 0.012 |
6.035 ± 0.029 | 5.081 ± 0.032 |
2.532 ± 0.019 | 9.49 ± 0.032 |
2.142 ± 0.015 | 2.979 ± 0.02 |
1.68 ± 0.026 | 10.234 ± 0.045 |
Met |
Asn |
Gln |
Pro |
Arg |
Ser |
Thr |
Val |
Trp |
Tyr |
|---|---|---|---|---|---|---|---|---|---|
1.601 ± 0.012 | 1.722 ± 0.023 |
6.754 ± 0.038 | 2.817 ± 0.027 |
8.844 ± 0.043 | 4.746 ± 0.03 |
5.922 ± 0.031 | 8.845 ± 0.037 |
1.663 ± 0.014 | 1.969 ± 0.018 |
Most of the basic statistics you can see at this page can be downloaded from this CSV file
Proteome-pI is available under Creative Commons Attribution-NoDerivs license, for more details see here
| Reference: Kozlowski LP. Proteome-pI 2.0: Proteome Isoelectric Point Database Update. Nucleic Acids Res. 2021, doi: 10.1093/nar/gkab944 | Contact: Lukasz P. Kozlowski |
