Chrysochromulina ericina virus (CeV01)
Taxonomy: Viruses; Varidnaviria; Bamfordvirae; Nucleocytoviricota; Megaviricetes; Algavirales; Phycodnaviridae; unclassified Phycodnaviridae
Average proteome isoelectric point is 7.26
Get precalculated fractions of proteins

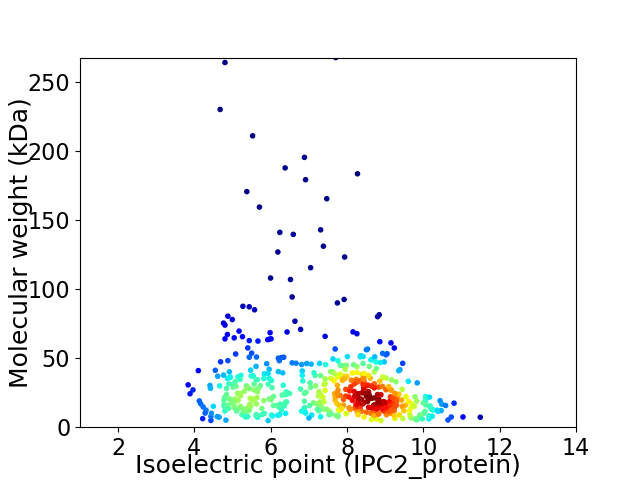
Virtual 2D-PAGE plot for 512 proteins (isoelectric point calculated using IPC2_protein)
Get csv file with sequences according to given criteria:
* You can choose from 21 different methods for calculating isoelectric point
Summary statistics related to proteome-wise predictions


Protein with the lowest isoelectric point:
>tr|A0A0N9R0B7|A0A0N9R0B7_CEV01 Ubox/RING superfamily domain containing protein OS=Chrysochromulina ericina virus OX=455364 GN=ceV_196 PE=4 SV=1
MM1 pKa = 7.61SSGFQLPGSLFVTQTNLSDD20 pKa = 3.9VGDD23 pKa = 3.7SMNRR27 pKa = 11.84VIQSEE32 pKa = 4.2IEE34 pKa = 4.07EE35 pKa = 4.27VARR38 pKa = 11.84TSNILASTNFAFYY51 pKa = 10.28IQADD55 pKa = 3.98YY56 pKa = 11.24NINNHH61 pKa = 5.53ISYY64 pKa = 9.55EE65 pKa = 4.1PSSSADD71 pKa = 3.6GLDD74 pKa = 3.37DD75 pKa = 4.76AYY77 pKa = 10.88AMSAITVDD85 pKa = 3.45SATATNAVIEE95 pKa = 4.38LQTADD100 pKa = 4.09GVPVQAGYY108 pKa = 10.43IDD110 pKa = 3.71AQNRR114 pKa = 11.84DD115 pKa = 3.44QEE117 pKa = 4.63TLGNFPVTLTVSVSNTGEE135 pKa = 3.82MSSTITITGEE145 pKa = 4.21GVVSSISEE153 pKa = 4.18NDD155 pKa = 3.04SKK157 pKa = 11.69AQVVYY162 pKa = 9.85WSGIEE167 pKa = 3.79STPIVDD173 pKa = 3.39ATSVDD178 pKa = 3.7VHH180 pKa = 7.36SSTLTVADD188 pKa = 5.39LLAQYY193 pKa = 10.25QSQLQSIEE201 pKa = 4.02SQYY204 pKa = 11.77NNINMIEE211 pKa = 3.99TWRR214 pKa = 11.84IEE216 pKa = 3.79ILGIDD221 pKa = 3.64AGVSNPLSQHH231 pKa = 4.81ARR233 pKa = 11.84AVNKK237 pKa = 10.35AGSQSVFSPGDD248 pKa = 3.39KK249 pKa = 9.88IVCQNTFSYY258 pKa = 10.65EE259 pKa = 4.09VVINDD264 pKa = 3.68YY265 pKa = 10.83QEE267 pKa = 4.14IAPTTIVSSTNVYY280 pKa = 10.38GVLQQII286 pKa = 4.22
MM1 pKa = 7.61SSGFQLPGSLFVTQTNLSDD20 pKa = 3.9VGDD23 pKa = 3.7SMNRR27 pKa = 11.84VIQSEE32 pKa = 4.2IEE34 pKa = 4.07EE35 pKa = 4.27VARR38 pKa = 11.84TSNILASTNFAFYY51 pKa = 10.28IQADD55 pKa = 3.98YY56 pKa = 11.24NINNHH61 pKa = 5.53ISYY64 pKa = 9.55EE65 pKa = 4.1PSSSADD71 pKa = 3.6GLDD74 pKa = 3.37DD75 pKa = 4.76AYY77 pKa = 10.88AMSAITVDD85 pKa = 3.45SATATNAVIEE95 pKa = 4.38LQTADD100 pKa = 4.09GVPVQAGYY108 pKa = 10.43IDD110 pKa = 3.71AQNRR114 pKa = 11.84DD115 pKa = 3.44QEE117 pKa = 4.63TLGNFPVTLTVSVSNTGEE135 pKa = 3.82MSSTITITGEE145 pKa = 4.21GVVSSISEE153 pKa = 4.18NDD155 pKa = 3.04SKK157 pKa = 11.69AQVVYY162 pKa = 9.85WSGIEE167 pKa = 3.79STPIVDD173 pKa = 3.39ATSVDD178 pKa = 3.7VHH180 pKa = 7.36SSTLTVADD188 pKa = 5.39LLAQYY193 pKa = 10.25QSQLQSIEE201 pKa = 4.02SQYY204 pKa = 11.77NNINMIEE211 pKa = 3.99TWRR214 pKa = 11.84IEE216 pKa = 3.79ILGIDD221 pKa = 3.64AGVSNPLSQHH231 pKa = 4.81ARR233 pKa = 11.84AVNKK237 pKa = 10.35AGSQSVFSPGDD248 pKa = 3.39KK249 pKa = 9.88IVCQNTFSYY258 pKa = 10.65EE259 pKa = 4.09VVINDD264 pKa = 3.68YY265 pKa = 10.83QEE267 pKa = 4.14IAPTTIVSSTNVYY280 pKa = 10.38GVLQQII286 pKa = 4.22
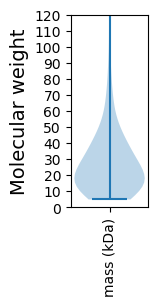
Molecular weight: 30.65 kDa
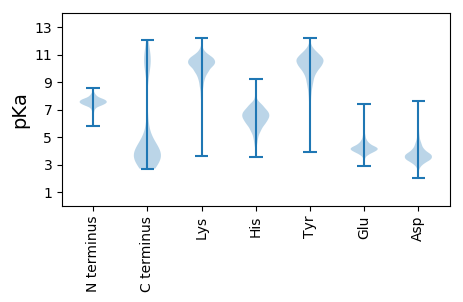
Isoelectric point according different methods:
Protein with the highest isoelectric point:
>tr|A0A0N9R4A1|A0A0N9R4A1_CEV01 Uncharacterized protein OS=Chrysochromulina ericina virus OX=455364 GN=ceV_445 PE=4 SV=1
MM1 pKa = 7.51IGGARR6 pKa = 11.84RR7 pKa = 11.84TRR9 pKa = 11.84RR10 pKa = 11.84GGRR13 pKa = 11.84SRR15 pKa = 11.84RR16 pKa = 11.84RR17 pKa = 11.84GGMRR21 pKa = 11.84GSQNLALNALLTGMVLSRR39 pKa = 11.84GKK41 pKa = 9.93KK42 pKa = 9.1RR43 pKa = 11.84KK44 pKa = 8.67GKK46 pKa = 9.89KK47 pKa = 8.36SRR49 pKa = 11.84RR50 pKa = 11.84LSKK53 pKa = 10.31LSRR56 pKa = 11.84RR57 pKa = 11.84GGRR60 pKa = 11.84TRR62 pKa = 11.84RR63 pKa = 11.84RR64 pKa = 3.36
MM1 pKa = 7.51IGGARR6 pKa = 11.84RR7 pKa = 11.84TRR9 pKa = 11.84RR10 pKa = 11.84GGRR13 pKa = 11.84SRR15 pKa = 11.84RR16 pKa = 11.84RR17 pKa = 11.84GGMRR21 pKa = 11.84GSQNLALNALLTGMVLSRR39 pKa = 11.84GKK41 pKa = 9.93KK42 pKa = 9.1RR43 pKa = 11.84KK44 pKa = 8.67GKK46 pKa = 9.89KK47 pKa = 8.36SRR49 pKa = 11.84RR50 pKa = 11.84LSKK53 pKa = 10.31LSRR56 pKa = 11.84RR57 pKa = 11.84GGRR60 pKa = 11.84TRR62 pKa = 11.84RR63 pKa = 11.84RR64 pKa = 3.36
Molecular weight: 7.23 kDa
Isoelectric point according different methods:
Peptides (in silico digests for buttom-up proteomics)
Below you can find in silico digests of the whole proteome with Trypsin, Chymotrypsin, Trypsin+LysC, LysN, ArgC proteases suitable for different mass spec machines.| Try ESI |
 |
|---|
| ChTry ESI |
 |
|---|
| ArgC ESI |
 |
|---|
| LysN ESI |
 |
|---|
| TryLysC ESI |
 |
|---|
| Try MALDI |
 |
|---|
| ChTry MALDI |
 |
|---|
| ArgC MALDI |
 |
|---|
| LysN MALDI |
 |
|---|
| TryLysC MALDI |
 |
|---|
| Try LTQ |
 |
|---|
| ChTry LTQ |
 |
|---|
| ArgC LTQ |
 |
|---|
| LysN LTQ |
 |
|---|
| TryLysC LTQ |
 |
|---|
| Try MSlow |
 |
|---|
| ChTry MSlow |
 |
|---|
| ArgC MSlow |
 |
|---|
| LysN MSlow |
 |
|---|
| TryLysC MSlow |
 |
|---|
| Try MShigh |
 |
|---|
| ChTry MShigh |
 |
|---|
| ArgC MShigh |
 |
|---|
| LysN MShigh |
 |
|---|
| TryLysC MShigh |
 |
|---|
General Statistics
Number of major isoforms |
Number of additional isoforms |
Number of all proteins |
Number of amino acids |
Min. Seq. Length |
Max. Seq. Length |
Avg. Seq. Length |
Avg. Mol. Weight |
|---|---|---|---|---|---|---|---|
0 |
143154 |
41 |
2317 |
279.6 |
32.29 |
Amino acid frequency
Ala |
Cys |
Asp |
Glu |
Phe |
Gly |
His |
Ile |
Lys |
Leu |
|---|---|---|---|---|---|---|---|---|---|
3.523 ± 0.11 | 1.703 ± 0.051 |
5.694 ± 0.078 | 5.977 ± 0.138 |
4.396 ± 0.068 | 4.564 ± 0.119 |
1.702 ± 0.048 | 9.902 ± 0.162 |
9.496 ± 0.154 | 8.83 ± 0.107 |
Met |
Asn |
Gln |
Pro |
Arg |
Ser |
Thr |
Val |
Trp |
Tyr |
|---|---|---|---|---|---|---|---|---|---|
2.022 ± 0.057 | 9.205 ± 0.16 |
3.641 ± 0.104 | 3.432 ± 0.094 |
3.456 ± 0.091 | 6.7 ± 0.091 |
5.475 ± 0.083 | 4.281 ± 0.082 |
0.958 ± 0.037 | 5.042 ± 0.09 |
Most of the basic statistics you can see at this page can be downloaded from this CSV file
Proteome-pI is available under Creative Commons Attribution-NoDerivs license, for more details see here
| Reference: Kozlowski LP. Proteome-pI 2.0: Proteome Isoelectric Point Database Update. Nucleic Acids Res. 2021, doi: 10.1093/nar/gkab944 | Contact: Lukasz P. Kozlowski |
