Butterbur mosaic virus
Taxonomy: Viruses; Riboviria; Orthornavirae; Kitrinoviricota; Alsuviricetes; Tymovirales; Betaflexiviridae; Quinvirinae; Carlavirus
Average proteome isoelectric point is 7.02
Get precalculated fractions of proteins

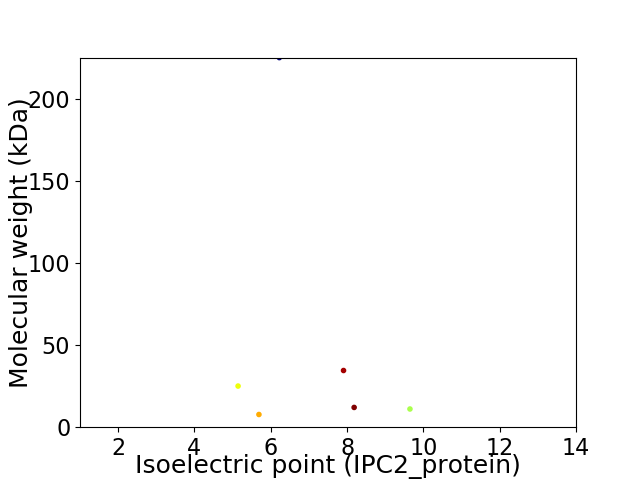
Virtual 2D-PAGE plot for 6 proteins (isoelectric point calculated using IPC2_protein)
Get csv file with sequences according to given criteria:
* You can choose from 21 different methods for calculating isoelectric point
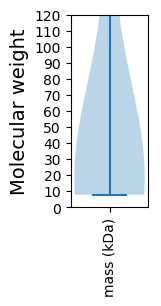
Summary statistics related to proteome-wise predictions


Protein with the lowest isoelectric point:
>tr|D2Z044|D2Z044_9VIRU Movement protein TGB2 OS=Butterbur mosaic virus OX=666859 PE=3 SV=1
MM1 pKa = 7.85DD2 pKa = 3.88VLVAKK7 pKa = 10.23CLEE10 pKa = 4.09FGFIRR15 pKa = 11.84VSISSSKK22 pKa = 9.79PQVIHH27 pKa = 6.22CVPGAGKK34 pKa = 10.33SSLIRR39 pKa = 11.84AILRR43 pKa = 11.84ADD45 pKa = 3.15SRR47 pKa = 11.84FYY49 pKa = 11.29AVTGGVPDD57 pKa = 4.63PVTGQQGRR65 pKa = 11.84ILPLDD70 pKa = 3.84GTAHH74 pKa = 7.17PGACFKK80 pKa = 11.07LVDD83 pKa = 4.31EE84 pKa = 4.36YY85 pKa = 11.4TEE87 pKa = 3.96AVEE90 pKa = 4.76AIEE93 pKa = 4.12GAFAIFGDD101 pKa = 4.14PVQSKK106 pKa = 9.78RR107 pKa = 11.84ASPLLPNFISLNTRR121 pKa = 11.84RR122 pKa = 11.84FGSSTCDD129 pKa = 3.41LLKK132 pKa = 10.91VFGFEE137 pKa = 4.2VYY139 pKa = 8.42STKK142 pKa = 10.89EE143 pKa = 3.81DD144 pKa = 3.45VVQIARR150 pKa = 11.84ADD152 pKa = 3.54QSEE155 pKa = 4.61VEE157 pKa = 4.33GKK159 pKa = 10.75LIVLGDD165 pKa = 3.63EE166 pKa = 4.61AKK168 pKa = 10.9ALACYY173 pKa = 10.47YY174 pKa = 10.39NLEE177 pKa = 4.21YY178 pKa = 10.16LTADD182 pKa = 3.4SARR185 pKa = 11.84GKK187 pKa = 8.55TYY189 pKa = 10.44PVVTLLTGFSEE200 pKa = 5.11VPAEE204 pKa = 4.47EE205 pKa = 4.58YY206 pKa = 10.1PDD208 pKa = 5.31LYY210 pKa = 11.47VCLTRR215 pKa = 11.84HH216 pKa = 5.12QEE218 pKa = 3.92KK219 pKa = 10.8LLVLTGDD226 pKa = 4.4ASCTPAA232 pKa = 5.2
MM1 pKa = 7.85DD2 pKa = 3.88VLVAKK7 pKa = 10.23CLEE10 pKa = 4.09FGFIRR15 pKa = 11.84VSISSSKK22 pKa = 9.79PQVIHH27 pKa = 6.22CVPGAGKK34 pKa = 10.33SSLIRR39 pKa = 11.84AILRR43 pKa = 11.84ADD45 pKa = 3.15SRR47 pKa = 11.84FYY49 pKa = 11.29AVTGGVPDD57 pKa = 4.63PVTGQQGRR65 pKa = 11.84ILPLDD70 pKa = 3.84GTAHH74 pKa = 7.17PGACFKK80 pKa = 11.07LVDD83 pKa = 4.31EE84 pKa = 4.36YY85 pKa = 11.4TEE87 pKa = 3.96AVEE90 pKa = 4.76AIEE93 pKa = 4.12GAFAIFGDD101 pKa = 4.14PVQSKK106 pKa = 9.78RR107 pKa = 11.84ASPLLPNFISLNTRR121 pKa = 11.84RR122 pKa = 11.84FGSSTCDD129 pKa = 3.41LLKK132 pKa = 10.91VFGFEE137 pKa = 4.2VYY139 pKa = 8.42STKK142 pKa = 10.89EE143 pKa = 3.81DD144 pKa = 3.45VVQIARR150 pKa = 11.84ADD152 pKa = 3.54QSEE155 pKa = 4.61VEE157 pKa = 4.33GKK159 pKa = 10.75LIVLGDD165 pKa = 3.63EE166 pKa = 4.61AKK168 pKa = 10.9ALACYY173 pKa = 10.47YY174 pKa = 10.39NLEE177 pKa = 4.21YY178 pKa = 10.16LTADD182 pKa = 3.4SARR185 pKa = 11.84GKK187 pKa = 8.55TYY189 pKa = 10.44PVVTLLTGFSEE200 pKa = 5.11VPAEE204 pKa = 4.47EE205 pKa = 4.58YY206 pKa = 10.1PDD208 pKa = 5.31LYY210 pKa = 11.47VCLTRR215 pKa = 11.84HH216 pKa = 5.12QEE218 pKa = 3.92KK219 pKa = 10.8LLVLTGDD226 pKa = 4.4ASCTPAA232 pKa = 5.2
Molecular weight: 25.06 kDa
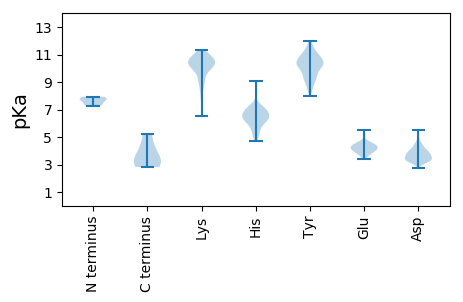
Isoelectric point according different methods:
Protein with the highest isoelectric point:
>tr|D2Z047|D2Z047_9VIRU RNA silencing suppressor OS=Butterbur mosaic virus OX=666859 PE=3 SV=1
MM1 pKa = 7.68SKK3 pKa = 10.5RR4 pKa = 11.84FVKK7 pKa = 10.44RR8 pKa = 11.84FLQARR13 pKa = 11.84FRR15 pKa = 11.84DD16 pKa = 4.05VSGLPKK22 pKa = 10.69GSFGDD27 pKa = 4.31LINIIVSRR35 pKa = 11.84VFEE38 pKa = 4.31GEE40 pKa = 3.99PGQSKK45 pKa = 9.16YY46 pKa = 11.14AKK48 pKa = 9.06EE49 pKa = 3.67RR50 pKa = 11.84RR51 pKa = 11.84AMKK54 pKa = 10.06IGRR57 pKa = 11.84CPRR60 pKa = 11.84CYY62 pKa = 9.39RR63 pKa = 11.84VSPGFYY69 pKa = 9.14FTTRR73 pKa = 11.84CDD75 pKa = 3.36GVTCVPGISYY85 pKa = 10.68NVAKK89 pKa = 9.19MQYY92 pKa = 9.42IKK94 pKa = 11.2YY95 pKa = 10.1GVV97 pKa = 3.03
MM1 pKa = 7.68SKK3 pKa = 10.5RR4 pKa = 11.84FVKK7 pKa = 10.44RR8 pKa = 11.84FLQARR13 pKa = 11.84FRR15 pKa = 11.84DD16 pKa = 4.05VSGLPKK22 pKa = 10.69GSFGDD27 pKa = 4.31LINIIVSRR35 pKa = 11.84VFEE38 pKa = 4.31GEE40 pKa = 3.99PGQSKK45 pKa = 9.16YY46 pKa = 11.14AKK48 pKa = 9.06EE49 pKa = 3.67RR50 pKa = 11.84RR51 pKa = 11.84AMKK54 pKa = 10.06IGRR57 pKa = 11.84CPRR60 pKa = 11.84CYY62 pKa = 9.39RR63 pKa = 11.84VSPGFYY69 pKa = 9.14FTTRR73 pKa = 11.84CDD75 pKa = 3.36GVTCVPGISYY85 pKa = 10.68NVAKK89 pKa = 9.19MQYY92 pKa = 9.42IKK94 pKa = 11.2YY95 pKa = 10.1GVV97 pKa = 3.03
Molecular weight: 11.09 kDa
Isoelectric point according different methods:
Peptides (in silico digests for buttom-up proteomics)
Below you can find in silico digests of the whole proteome with Trypsin, Chymotrypsin, Trypsin+LysC, LysN, ArgC proteases suitable for different mass spec machines.| Try ESI |
 |
|---|
| ChTry ESI |
 |
|---|
| ArgC ESI |
 |
|---|
| LysN ESI |
 |
|---|
| TryLysC ESI |
 |
|---|
| Try MALDI |
 |
|---|
| ChTry MALDI |
 |
|---|
| ArgC MALDI |
 |
|---|
| LysN MALDI |
 |
|---|
| TryLysC MALDI |
 |
|---|
| Try LTQ |
 |
|---|
| ChTry LTQ |
 |
|---|
| ArgC LTQ |
 |
|---|
| LysN LTQ |
 |
|---|
| TryLysC LTQ |
 |
|---|
| Try MSlow |
 |
|---|
| ChTry MSlow |
 |
|---|
| ArgC MSlow |
 |
|---|
| LysN MSlow |
 |
|---|
| TryLysC MSlow |
 |
|---|
| Try MShigh |
 |
|---|
| ChTry MShigh |
 |
|---|
| ArgC MShigh |
 |
|---|
| LysN MShigh |
 |
|---|
| TryLysC MShigh |
 |
|---|
General Statistics
Number of major isoforms |
Number of additional isoforms |
Number of all proteins |
Number of amino acids |
Min. Seq. Length |
Max. Seq. Length |
Avg. Seq. Length |
Avg. Mol. Weight |
|---|---|---|---|---|---|---|---|
0 |
2824 |
70 |
1997 |
470.7 |
52.59 |
Amino acid frequency
Ala |
Cys |
Asp |
Glu |
Phe |
Gly |
His |
Ile |
Lys |
Leu |
|---|---|---|---|---|---|---|---|---|---|
6.905 ± 0.682 | 2.514 ± 0.553 |
5.276 ± 0.241 | 5.984 ± 0.916 |
5.701 ± 0.413 | 6.763 ± 0.658 |
2.797 ± 0.511 | 4.958 ± 0.292 |
6.268 ± 0.546 | 10.375 ± 1.266 |
Met |
Asn |
Gln |
Pro |
Arg |
Ser |
Thr |
Val |
Trp |
Tyr |
|---|---|---|---|---|---|---|---|---|---|
1.983 ± 0.377 | 4.214 ± 0.772 |
4.71 ± 0.885 | 2.797 ± 0.261 |
5.028 ± 0.444 | 8.357 ± 0.32 |
5.524 ± 0.388 | 5.595 ± 1.079 |
0.744 ± 0.214 | 3.506 ± 0.621 |
Most of the basic statistics you can see at this page can be downloaded from this CSV file
Proteome-pI is available under Creative Commons Attribution-NoDerivs license, for more details see here
| Reference: Kozlowski LP. Proteome-pI 2.0: Proteome Isoelectric Point Database Update. Nucleic Acids Res. 2021, doi: 10.1093/nar/gkab944 | Contact: Lukasz P. Kozlowski |
