Prevotella sp. oral taxon 317 str. F0108
Taxonomy: cellular organisms; Bacteria; FCB group; Bacteroidetes/Chlorobi group; Bacteroidetes; Bacteroidia; Bacteroidales; Prevotellaceae; Prevotella; unclassified Prevotella; Prevotella sp. oral taxon 317
Average proteome isoelectric point is 6.93
Get precalculated fractions of proteins

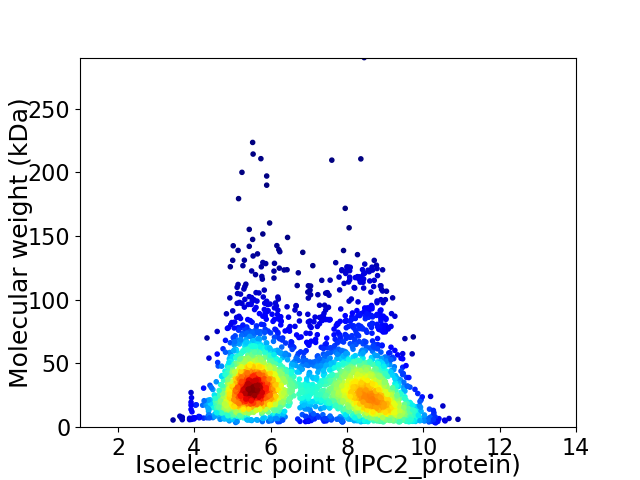
Virtual 2D-PAGE plot for 2926 proteins (isoelectric point calculated using IPC2_protein)
Get csv file with sequences according to given criteria:
* You can choose from 21 different methods for calculating isoelectric point
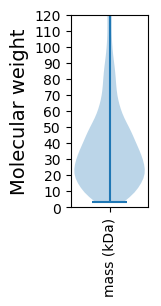
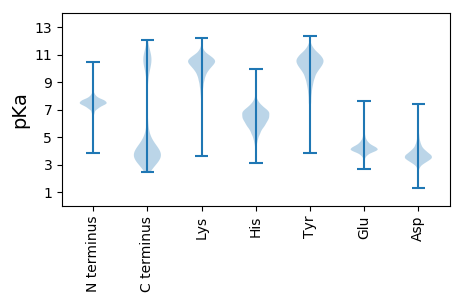
Summary statistics related to proteome-wise predictions


Protein with the lowest isoelectric point:
>tr|D3IH30|D3IH30_9BACT Uncharacterized protein OS=Prevotella sp. oral taxon 317 str. F0108 OX=575615 GN=HMPREF0670_00649 PE=4 SV=1
MM1 pKa = 7.6KK2 pKa = 9.97EE3 pKa = 4.26KK4 pKa = 9.91LTEE7 pKa = 4.1GCIMLVFIAFVVLGSTMAVNMFQQGAWVKK36 pKa = 10.75GIICVLGALFFGFPLLGPFLPSAAPDD62 pKa = 3.69TKK64 pKa = 10.36PLPFVPQVNLPTDD77 pKa = 3.74KK78 pKa = 11.27DD79 pKa = 3.9SLRR82 pKa = 11.84EE83 pKa = 3.9LAKK86 pKa = 10.15MLAGEE91 pKa = 4.53EE92 pKa = 4.11ADD94 pKa = 3.53VMQTVEE100 pKa = 4.68EE101 pKa = 4.2LLEE104 pKa = 4.42SPEE107 pKa = 4.15AFYY110 pKa = 10.92SAQITRR116 pKa = 11.84DD117 pKa = 2.57GWYY120 pKa = 9.59NDD122 pKa = 3.65AYY124 pKa = 11.12VDD126 pKa = 3.36IWDD129 pKa = 4.71MYY131 pKa = 10.83HH132 pKa = 6.92DD133 pKa = 4.3QPDD136 pKa = 3.97VLCSEE141 pKa = 4.29GLLFVLAEE149 pKa = 4.21AEE151 pKa = 4.37VIAMFDD157 pKa = 3.04WKK159 pKa = 10.74EE160 pKa = 3.78GLEE163 pKa = 4.11EE164 pKa = 4.67FVGQMTDD171 pKa = 3.51LRR173 pKa = 11.84RR174 pKa = 11.84AQANNLPVPQEE185 pKa = 4.28HH186 pKa = 7.0FDD188 pKa = 3.68EE189 pKa = 4.73QADD192 pKa = 3.73IPHH195 pKa = 7.08WCNALNEE202 pKa = 4.19LWQPLGYY209 pKa = 10.22NATFIDD215 pKa = 3.93TDD217 pKa = 3.42GDD219 pKa = 3.88EE220 pKa = 4.71YY221 pKa = 10.89IVAVVQYY228 pKa = 9.05TPSPPIDD235 pKa = 5.49DD236 pKa = 4.31ISCTTQSS243 pKa = 3.02
MM1 pKa = 7.6KK2 pKa = 9.97EE3 pKa = 4.26KK4 pKa = 9.91LTEE7 pKa = 4.1GCIMLVFIAFVVLGSTMAVNMFQQGAWVKK36 pKa = 10.75GIICVLGALFFGFPLLGPFLPSAAPDD62 pKa = 3.69TKK64 pKa = 10.36PLPFVPQVNLPTDD77 pKa = 3.74KK78 pKa = 11.27DD79 pKa = 3.9SLRR82 pKa = 11.84EE83 pKa = 3.9LAKK86 pKa = 10.15MLAGEE91 pKa = 4.53EE92 pKa = 4.11ADD94 pKa = 3.53VMQTVEE100 pKa = 4.68EE101 pKa = 4.2LLEE104 pKa = 4.42SPEE107 pKa = 4.15AFYY110 pKa = 10.92SAQITRR116 pKa = 11.84DD117 pKa = 2.57GWYY120 pKa = 9.59NDD122 pKa = 3.65AYY124 pKa = 11.12VDD126 pKa = 3.36IWDD129 pKa = 4.71MYY131 pKa = 10.83HH132 pKa = 6.92DD133 pKa = 4.3QPDD136 pKa = 3.97VLCSEE141 pKa = 4.29GLLFVLAEE149 pKa = 4.21AEE151 pKa = 4.37VIAMFDD157 pKa = 3.04WKK159 pKa = 10.74EE160 pKa = 3.78GLEE163 pKa = 4.11EE164 pKa = 4.67FVGQMTDD171 pKa = 3.51LRR173 pKa = 11.84RR174 pKa = 11.84AQANNLPVPQEE185 pKa = 4.28HH186 pKa = 7.0FDD188 pKa = 3.68EE189 pKa = 4.73QADD192 pKa = 3.73IPHH195 pKa = 7.08WCNALNEE202 pKa = 4.19LWQPLGYY209 pKa = 10.22NATFIDD215 pKa = 3.93TDD217 pKa = 3.42GDD219 pKa = 3.88EE220 pKa = 4.71YY221 pKa = 10.89IVAVVQYY228 pKa = 9.05TPSPPIDD235 pKa = 5.49DD236 pKa = 4.31ISCTTQSS243 pKa = 3.02
Molecular weight: 27.2 kDa
Isoelectric point according different methods:
Protein with the highest isoelectric point:
>tr|D3IIL1|D3IIL1_9BACT Pyridoxal 5'-phosphate synthase subunit PdxT OS=Prevotella sp. oral taxon 317 str. F0108 OX=575615 GN=pdxT PE=3 SV=1
MM1 pKa = 7.54HH2 pKa = 7.37KK3 pKa = 11.04GEE5 pKa = 4.54FFISKK10 pKa = 9.67QSNYY14 pKa = 10.0DD15 pKa = 3.35DD16 pKa = 4.78KK17 pKa = 11.36RR18 pKa = 11.84ITGQTCLADD27 pKa = 3.94DD28 pKa = 3.77RR29 pKa = 11.84RR30 pKa = 11.84GIAFPCTTRR39 pKa = 11.84QYY41 pKa = 8.73GHH43 pKa = 6.8KK44 pKa = 8.79WRR46 pKa = 11.84NSKK49 pKa = 10.56GINRR53 pKa = 11.84QRR55 pKa = 11.84KK56 pKa = 7.52KK57 pKa = 10.65RR58 pKa = 11.84YY59 pKa = 8.28VSGLAGIARR68 pKa = 11.84LFRR71 pKa = 11.84CSLPTANRR79 pKa = 11.84IKK81 pKa = 10.63QGGKK85 pKa = 8.64INRR88 pKa = 11.84AITQVGCKK96 pKa = 9.66IIVEE100 pKa = 4.22AEE102 pKa = 4.02LALEE106 pKa = 3.89LAGRR110 pKa = 11.84KK111 pKa = 7.58TGGRR115 pKa = 3.58
MM1 pKa = 7.54HH2 pKa = 7.37KK3 pKa = 11.04GEE5 pKa = 4.54FFISKK10 pKa = 9.67QSNYY14 pKa = 10.0DD15 pKa = 3.35DD16 pKa = 4.78KK17 pKa = 11.36RR18 pKa = 11.84ITGQTCLADD27 pKa = 3.94DD28 pKa = 3.77RR29 pKa = 11.84RR30 pKa = 11.84GIAFPCTTRR39 pKa = 11.84QYY41 pKa = 8.73GHH43 pKa = 6.8KK44 pKa = 8.79WRR46 pKa = 11.84NSKK49 pKa = 10.56GINRR53 pKa = 11.84QRR55 pKa = 11.84KK56 pKa = 7.52KK57 pKa = 10.65RR58 pKa = 11.84YY59 pKa = 8.28VSGLAGIARR68 pKa = 11.84LFRR71 pKa = 11.84CSLPTANRR79 pKa = 11.84IKK81 pKa = 10.63QGGKK85 pKa = 8.64INRR88 pKa = 11.84AITQVGCKK96 pKa = 9.66IIVEE100 pKa = 4.22AEE102 pKa = 4.02LALEE106 pKa = 3.89LAGRR110 pKa = 11.84KK111 pKa = 7.58TGGRR115 pKa = 3.58
Molecular weight: 12.95 kDa
Isoelectric point according different methods:
Peptides (in silico digests for buttom-up proteomics)
Below you can find in silico digests of the whole proteome with Trypsin, Chymotrypsin, Trypsin+LysC, LysN, ArgC proteases suitable for different mass spec machines.| Try ESI |
 |
|---|
| ChTry ESI |
 |
|---|
| ArgC ESI |
 |
|---|
| LysN ESI |
 |
|---|
| TryLysC ESI |
 |
|---|
| Try MALDI |
 |
|---|
| ChTry MALDI |
 |
|---|
| ArgC MALDI |
 |
|---|
| LysN MALDI |
 |
|---|
| TryLysC MALDI |
 |
|---|
| Try LTQ |
 |
|---|
| ChTry LTQ |
 |
|---|
| ArgC LTQ |
 |
|---|
| LysN LTQ |
 |
|---|
| TryLysC LTQ |
 |
|---|
| Try MSlow |
 |
|---|
| ChTry MSlow |
 |
|---|
| ArgC MSlow |
 |
|---|
| LysN MSlow |
 |
|---|
| TryLysC MSlow |
 |
|---|
| Try MShigh |
 |
|---|
| ChTry MShigh |
 |
|---|
| ArgC MShigh |
 |
|---|
| LysN MShigh |
 |
|---|
| TryLysC MShigh |
 |
|---|
General Statistics
Number of major isoforms |
Number of additional isoforms |
Number of all proteins |
Number of amino acids |
Min. Seq. Length |
Max. Seq. Length |
Avg. Seq. Length |
Avg. Mol. Weight |
|---|---|---|---|---|---|---|---|
0 |
1017484 |
30 |
2564 |
347.7 |
39.15 |
Amino acid frequency
Ala |
Cys |
Asp |
Glu |
Phe |
Gly |
His |
Ile |
Lys |
Leu |
|---|---|---|---|---|---|---|---|---|---|
7.779 ± 0.041 | 1.212 ± 0.018 |
5.559 ± 0.029 | 5.892 ± 0.046 |
4.483 ± 0.026 | 6.873 ± 0.042 |
2.034 ± 0.021 | 5.818 ± 0.035 |
6.493 ± 0.039 | 9.123 ± 0.042 |
Met |
Asn |
Gln |
Pro |
Arg |
Ser |
Thr |
Val |
Trp |
Tyr |
|---|---|---|---|---|---|---|---|---|---|
2.751 ± 0.022 | 5.335 ± 0.039 |
3.796 ± 0.023 | 3.774 ± 0.029 |
5.072 ± 0.031 | 5.762 ± 0.04 |
5.893 ± 0.039 | 6.778 ± 0.032 |
1.274 ± 0.017 | 4.299 ± 0.032 |
Most of the basic statistics you can see at this page can be downloaded from this CSV file
Proteome-pI is available under Creative Commons Attribution-NoDerivs license, for more details see here
| Reference: Kozlowski LP. Proteome-pI 2.0: Proteome Isoelectric Point Database Update. Nucleic Acids Res. 2021, doi: 10.1093/nar/gkab944 | Contact: Lukasz P. Kozlowski |
