Changjiang hepe-like virus 1
Taxonomy: Viruses; Riboviria; unclassified Riboviria; unclassified RNA viruses ShiM-2016
Average proteome isoelectric point is 6.62
Get precalculated fractions of proteins

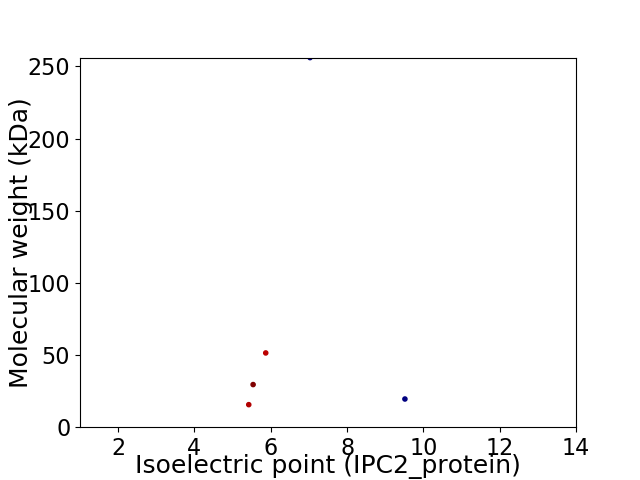
Virtual 2D-PAGE plot for 5 proteins (isoelectric point calculated using IPC2_protein)
Get csv file with sequences according to given criteria:
* You can choose from 21 different methods for calculating isoelectric point
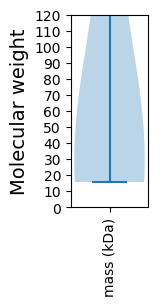
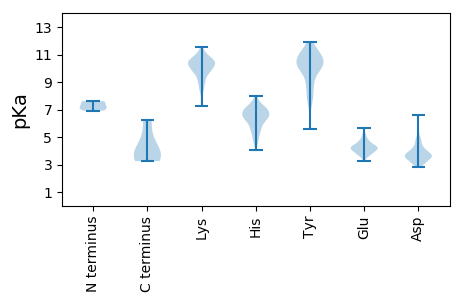
Summary statistics related to proteome-wise predictions


Protein with the lowest isoelectric point:
>tr|A0A1L3KJL8|A0A1L3KJL8_9VIRU Uncharacterized protein OS=Changjiang hepe-like virus 1 OX=1922772 PE=4 SV=1
MM1 pKa = 7.6TNFQPRR7 pKa = 11.84AHH9 pKa = 6.11TLEE12 pKa = 3.91VLQTNSEE19 pKa = 4.22HH20 pKa = 6.48TNQQFDD26 pKa = 3.56VSNANLQRR34 pKa = 11.84VLDD37 pKa = 3.63QFIINNEE44 pKa = 3.98KK45 pKa = 10.5LSQLNQQLATALEE58 pKa = 4.13NQTIIINKK66 pKa = 7.47FTEE69 pKa = 4.07QLLKK73 pKa = 10.03TDD75 pKa = 4.77SLIQNQQSSIEE86 pKa = 4.02HH87 pKa = 6.04QYY89 pKa = 11.24NIQKK93 pKa = 10.39SLEE96 pKa = 4.04AVQQTVTQTNGDD108 pKa = 3.64VSRR111 pKa = 11.84IATTVRR117 pKa = 11.84LGGKK121 pKa = 9.07NALAVTNTAADD132 pKa = 4.8PIWTIPAGG140 pKa = 3.55
MM1 pKa = 7.6TNFQPRR7 pKa = 11.84AHH9 pKa = 6.11TLEE12 pKa = 3.91VLQTNSEE19 pKa = 4.22HH20 pKa = 6.48TNQQFDD26 pKa = 3.56VSNANLQRR34 pKa = 11.84VLDD37 pKa = 3.63QFIINNEE44 pKa = 3.98KK45 pKa = 10.5LSQLNQQLATALEE58 pKa = 4.13NQTIIINKK66 pKa = 7.47FTEE69 pKa = 4.07QLLKK73 pKa = 10.03TDD75 pKa = 4.77SLIQNQQSSIEE86 pKa = 4.02HH87 pKa = 6.04QYY89 pKa = 11.24NIQKK93 pKa = 10.39SLEE96 pKa = 4.04AVQQTVTQTNGDD108 pKa = 3.64VSRR111 pKa = 11.84IATTVRR117 pKa = 11.84LGGKK121 pKa = 9.07NALAVTNTAADD132 pKa = 4.8PIWTIPAGG140 pKa = 3.55
Molecular weight: 15.63 kDa
Isoelectric point according different methods:
Protein with the highest isoelectric point:
>tr|A0A1L3KJN1|A0A1L3KJN1_9VIRU Non-structural protein 2 OS=Changjiang hepe-like virus 1 OX=1922772 PE=4 SV=1
MM1 pKa = 7.21PQTRR5 pKa = 11.84SEE7 pKa = 4.09HH8 pKa = 6.19SSNITWTPSSGQKK21 pKa = 9.1PASPSSHH28 pKa = 5.45QAPVLRR34 pKa = 11.84VGGARR39 pKa = 11.84ISRR42 pKa = 11.84VKK44 pKa = 9.78STASSRR50 pKa = 11.84TCSICAAHH58 pKa = 6.55CRR60 pKa = 11.84KK61 pKa = 10.17SLTNSKK67 pKa = 9.03HH68 pKa = 4.74HH69 pKa = 6.94HH70 pKa = 6.18EE71 pKa = 4.74NSLTLNDD78 pKa = 4.41RR79 pKa = 11.84SPPSNSRR86 pKa = 11.84RR87 pKa = 11.84LIFCDD92 pKa = 5.77APNCWLFVFHH102 pKa = 6.49SLCRR106 pKa = 11.84ACMMFPTQTVRR117 pKa = 11.84DD118 pKa = 3.66RR119 pKa = 11.84FRR121 pKa = 11.84RR122 pKa = 11.84LLAARR127 pKa = 11.84QLHH130 pKa = 6.31KK131 pKa = 10.45ISYY134 pKa = 7.95CCCARR139 pKa = 11.84NQNSFRR145 pKa = 11.84QIGPHH150 pKa = 6.88RR151 pKa = 11.84YY152 pKa = 7.8TNIAIQNPISFINHH166 pKa = 4.08VVDD169 pKa = 3.93YY170 pKa = 10.0FLL172 pKa = 6.21
MM1 pKa = 7.21PQTRR5 pKa = 11.84SEE7 pKa = 4.09HH8 pKa = 6.19SSNITWTPSSGQKK21 pKa = 9.1PASPSSHH28 pKa = 5.45QAPVLRR34 pKa = 11.84VGGARR39 pKa = 11.84ISRR42 pKa = 11.84VKK44 pKa = 9.78STASSRR50 pKa = 11.84TCSICAAHH58 pKa = 6.55CRR60 pKa = 11.84KK61 pKa = 10.17SLTNSKK67 pKa = 9.03HH68 pKa = 4.74HH69 pKa = 6.94HH70 pKa = 6.18EE71 pKa = 4.74NSLTLNDD78 pKa = 4.41RR79 pKa = 11.84SPPSNSRR86 pKa = 11.84RR87 pKa = 11.84LIFCDD92 pKa = 5.77APNCWLFVFHH102 pKa = 6.49SLCRR106 pKa = 11.84ACMMFPTQTVRR117 pKa = 11.84DD118 pKa = 3.66RR119 pKa = 11.84FRR121 pKa = 11.84RR122 pKa = 11.84LLAARR127 pKa = 11.84QLHH130 pKa = 6.31KK131 pKa = 10.45ISYY134 pKa = 7.95CCCARR139 pKa = 11.84NQNSFRR145 pKa = 11.84QIGPHH150 pKa = 6.88RR151 pKa = 11.84YY152 pKa = 7.8TNIAIQNPISFINHH166 pKa = 4.08VVDD169 pKa = 3.93YY170 pKa = 10.0FLL172 pKa = 6.21
Molecular weight: 19.54 kDa
Isoelectric point according different methods:
Peptides (in silico digests for buttom-up proteomics)
Below you can find in silico digests of the whole proteome with Trypsin, Chymotrypsin, Trypsin+LysC, LysN, ArgC proteases suitable for different mass spec machines.| Try ESI |
 |
|---|
| ChTry ESI |
 |
|---|
| ArgC ESI |
 |
|---|
| LysN ESI |
 |
|---|
| TryLysC ESI |
 |
|---|
| Try MALDI |
 |
|---|
| ChTry MALDI |
 |
|---|
| ArgC MALDI |
 |
|---|
| LysN MALDI |
 |
|---|
| TryLysC MALDI |
 |
|---|
| Try LTQ |
 |
|---|
| ChTry LTQ |
 |
|---|
| ArgC LTQ |
 |
|---|
| LysN LTQ |
 |
|---|
| TryLysC LTQ |
 |
|---|
| Try MSlow |
 |
|---|
| ChTry MSlow |
 |
|---|
| ArgC MSlow |
 |
|---|
| LysN MSlow |
 |
|---|
| TryLysC MSlow |
 |
|---|
| Try MShigh |
 |
|---|
| ChTry MShigh |
 |
|---|
| ArgC MShigh |
 |
|---|
| LysN MShigh |
 |
|---|
| TryLysC MShigh |
 |
|---|
General Statistics
Number of major isoforms |
Number of additional isoforms |
Number of all proteins |
Number of amino acids |
Min. Seq. Length |
Max. Seq. Length |
Avg. Seq. Length |
Avg. Mol. Weight |
|---|---|---|---|---|---|---|---|
0 |
3340 |
140 |
2290 |
668.0 |
74.46 |
Amino acid frequency
Ala |
Cys |
Asp |
Glu |
Phe |
Gly |
His |
Ile |
Lys |
Leu |
|---|---|---|---|---|---|---|---|---|---|
9.491 ± 0.626 | 1.527 ± 0.598 |
6.078 ± 0.649 | 4.371 ± 0.619 |
3.922 ± 0.343 | 5.449 ± 0.502 |
3.353 ± 0.432 | 6.168 ± 0.178 |
4.79 ± 0.851 | 8.473 ± 0.302 |
Met |
Asn |
Gln |
Pro |
Arg |
Ser |
Thr |
Val |
Trp |
Tyr |
|---|---|---|---|---|---|---|---|---|---|
1.617 ± 0.224 | 5.329 ± 0.631 |
4.491 ± 0.397 | 4.91 ± 0.942 |
5.898 ± 0.689 | 6.048 ± 1.78 |
7.066 ± 0.632 | 6.856 ± 0.531 |
0.988 ± 0.145 | 3.174 ± 0.401 |
Most of the basic statistics you can see at this page can be downloaded from this CSV file
Proteome-pI is available under Creative Commons Attribution-NoDerivs license, for more details see here
| Reference: Kozlowski LP. Proteome-pI 2.0: Proteome Isoelectric Point Database Update. Nucleic Acids Res. 2021, doi: 10.1093/nar/gkab944 | Contact: Lukasz P. Kozlowski |
