Dinoroseobacter shibae (strain DSM 16493 / NCIMB 14021 / DFL 12)
Taxonomy: cellular organisms; Bacteria; Proteobacteria; Alphaproteobacteria; Rhodobacterales; Roseobacteraceae; Dinoroseobacter; Dinoroseobacter shibae
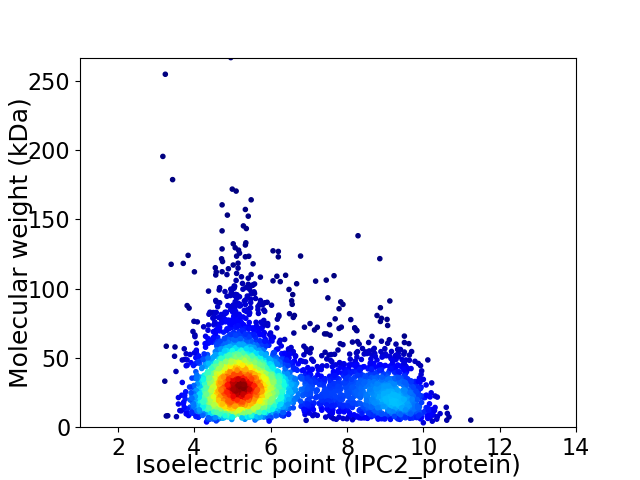
Average proteome isoelectric point is 6.13
Get precalculated fractions of proteins

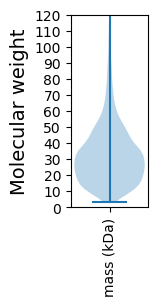
Virtual 2D-PAGE plot for 4086 proteins (isoelectric point calculated using IPC2_protein)
Get csv file with sequences according to given criteria:
* You can choose from 21 different methods for calculating isoelectric point
Summary statistics related to proteome-wise predictions


Protein with the lowest isoelectric point:
>sp|A8LLU7|RF1_DINSH Peptide chain release factor 1 OS=Dinoroseobacter shibae (strain DSM 16493 / NCIMB 14021 / DFL 12) OX=398580 GN=prfA PE=3 SV=1
MM1 pKa = 7.52KK2 pKa = 10.1SSKK5 pKa = 9.94FSPVVALALPLALFGAPSLAGSLEE29 pKa = 4.26DD30 pKa = 3.71PVVEE34 pKa = 4.39PVPMAPAPVVVSGRR48 pKa = 11.84DD49 pKa = 3.14WTGGYY54 pKa = 9.86VGAQIGYY61 pKa = 10.54GDD63 pKa = 3.84VGTNASGVDD72 pKa = 3.54GDD74 pKa = 4.29GLIGGLIAGYY84 pKa = 10.37DD85 pKa = 3.91YY86 pKa = 11.73DD87 pKa = 3.83FGSYY91 pKa = 10.13VLGAGIDD98 pKa = 3.81YY99 pKa = 10.59DD100 pKa = 4.4IADD103 pKa = 4.28IDD105 pKa = 4.54LGPASLEE112 pKa = 3.83DD113 pKa = 3.67VLRR116 pKa = 11.84LKK118 pKa = 10.77LRR120 pKa = 11.84AGFEE124 pKa = 4.33AGPSLIYY131 pKa = 9.9ATGGYY136 pKa = 9.94ARR138 pKa = 11.84AGTDD142 pKa = 3.38NLGSDD147 pKa = 4.55DD148 pKa = 3.71GWFAGAGVEE157 pKa = 4.61YY158 pKa = 9.91PLSQNLSLAGEE169 pKa = 4.27VLYY172 pKa = 11.1HH173 pKa = 6.63EE174 pKa = 5.71FDD176 pKa = 4.39DD177 pKa = 4.79FDD179 pKa = 5.78GSGVDD184 pKa = 3.59VDD186 pKa = 3.75ATTVQARR193 pKa = 11.84LAYY196 pKa = 10.21RR197 pKa = 11.84FF198 pKa = 3.57
MM1 pKa = 7.52KK2 pKa = 10.1SSKK5 pKa = 9.94FSPVVALALPLALFGAPSLAGSLEE29 pKa = 4.26DD30 pKa = 3.71PVVEE34 pKa = 4.39PVPMAPAPVVVSGRR48 pKa = 11.84DD49 pKa = 3.14WTGGYY54 pKa = 9.86VGAQIGYY61 pKa = 10.54GDD63 pKa = 3.84VGTNASGVDD72 pKa = 3.54GDD74 pKa = 4.29GLIGGLIAGYY84 pKa = 10.37DD85 pKa = 3.91YY86 pKa = 11.73DD87 pKa = 3.83FGSYY91 pKa = 10.13VLGAGIDD98 pKa = 3.81YY99 pKa = 10.59DD100 pKa = 4.4IADD103 pKa = 4.28IDD105 pKa = 4.54LGPASLEE112 pKa = 3.83DD113 pKa = 3.67VLRR116 pKa = 11.84LKK118 pKa = 10.77LRR120 pKa = 11.84AGFEE124 pKa = 4.33AGPSLIYY131 pKa = 9.9ATGGYY136 pKa = 9.94ARR138 pKa = 11.84AGTDD142 pKa = 3.38NLGSDD147 pKa = 4.55DD148 pKa = 3.71GWFAGAGVEE157 pKa = 4.61YY158 pKa = 9.91PLSQNLSLAGEE169 pKa = 4.27VLYY172 pKa = 11.1HH173 pKa = 6.63EE174 pKa = 5.71FDD176 pKa = 4.39DD177 pKa = 4.79FDD179 pKa = 5.78GSGVDD184 pKa = 3.59VDD186 pKa = 3.75ATTVQARR193 pKa = 11.84LAYY196 pKa = 10.21RR197 pKa = 11.84FF198 pKa = 3.57
Molecular weight: 20.34 kDa
Isoelectric point according different methods:
Protein with the highest isoelectric point:
>tr|A8LMB7|A8LMB7_DINSH Uncharacterized protein OS=Dinoroseobacter shibae (strain DSM 16493 / NCIMB 14021 / DFL 12) OX=398580 GN=Dshi_0345 PE=4 SV=1
MM1 pKa = 7.45KK2 pKa = 9.61RR3 pKa = 11.84TFQPSNLVRR12 pKa = 11.84KK13 pKa = 9.18RR14 pKa = 11.84RR15 pKa = 11.84HH16 pKa = 4.42GFRR19 pKa = 11.84ARR21 pKa = 11.84MATKK25 pKa = 10.37AGRR28 pKa = 11.84KK29 pKa = 8.54ILNARR34 pKa = 11.84RR35 pKa = 11.84ARR37 pKa = 11.84GRR39 pKa = 11.84KK40 pKa = 9.07SLSAA44 pKa = 3.93
MM1 pKa = 7.45KK2 pKa = 9.61RR3 pKa = 11.84TFQPSNLVRR12 pKa = 11.84KK13 pKa = 9.18RR14 pKa = 11.84RR15 pKa = 11.84HH16 pKa = 4.42GFRR19 pKa = 11.84ARR21 pKa = 11.84MATKK25 pKa = 10.37AGRR28 pKa = 11.84KK29 pKa = 8.54ILNARR34 pKa = 11.84RR35 pKa = 11.84ARR37 pKa = 11.84GRR39 pKa = 11.84KK40 pKa = 9.07SLSAA44 pKa = 3.93
Molecular weight: 5.14 kDa
Isoelectric point according different methods:
Peptides (in silico digests for buttom-up proteomics)
Below you can find in silico digests of the whole proteome with Trypsin, Chymotrypsin, Trypsin+LysC, LysN, ArgC proteases suitable for different mass spec machines.| Try ESI |
 |
|---|
| ChTry ESI |
 |
|---|
| ArgC ESI |
 |
|---|
| LysN ESI |
 |
|---|
| TryLysC ESI |
 |
|---|
| Try MALDI |
 |
|---|
| ChTry MALDI |
 |
|---|
| ArgC MALDI |
 |
|---|
| LysN MALDI |
 |
|---|
| TryLysC MALDI |
 |
|---|
| Try LTQ |
 |
|---|
| ChTry LTQ |
 |
|---|
| ArgC LTQ |
 |
|---|
| LysN LTQ |
 |
|---|
| TryLysC LTQ |
 |
|---|
| Try MSlow |
 |
|---|
| ChTry MSlow |
 |
|---|
| ArgC MSlow |
 |
|---|
| LysN MSlow |
 |
|---|
| TryLysC MSlow |
 |
|---|
| Try MShigh |
 |
|---|
| ChTry MShigh |
 |
|---|
| ArgC MShigh |
 |
|---|
| LysN MShigh |
 |
|---|
| TryLysC MShigh |
 |
|---|
General Statistics
Number of major isoforms |
Number of additional isoforms |
Number of all proteins |
Number of amino acids |
Min. Seq. Length |
Max. Seq. Length |
Avg. Seq. Length |
Avg. Mol. Weight |
|---|---|---|---|---|---|---|---|
0 |
1291468 |
28 |
2553 |
316.1 |
34.15 |
Amino acid frequency
Ala |
Cys |
Asp |
Glu |
Phe |
Gly |
His |
Ile |
Lys |
Leu |
|---|---|---|---|---|---|---|---|---|---|
13.082 ± 0.048 | 0.884 ± 0.012 |
5.958 ± 0.035 | 5.821 ± 0.036 |
3.709 ± 0.025 | 8.759 ± 0.042 |
1.95 ± 0.019 | 4.909 ± 0.03 |
2.736 ± 0.029 | 10.32 ± 0.044 |
Met |
Asn |
Gln |
Pro |
Arg |
Ser |
Thr |
Val |
Trp |
Tyr |
|---|---|---|---|---|---|---|---|---|---|
2.653 ± 0.019 | 2.322 ± 0.021 |
5.471 ± 0.031 | 3.049 ± 0.018 |
6.939 ± 0.045 | 4.878 ± 0.023 |
5.663 ± 0.028 | 7.373 ± 0.034 |
1.4 ± 0.015 | 2.12 ± 0.019 |
Most of the basic statistics you can see at this page can be downloaded from this CSV file
Proteome-pI is available under Creative Commons Attribution-NoDerivs license, for more details see here
| Reference: Kozlowski LP. Proteome-pI 2.0: Proteome Isoelectric Point Database Update. Nucleic Acids Res. 2021, doi: 10.1093/nar/gkab944 | Contact: Lukasz P. Kozlowski |
