Ignavigranum ruoffiae
Taxonomy: cellular organisms; Bacteria; Terrabacteria group; Firmicutes; Bacilli; Lactobacillales; Aerococcaceae; Ignavigranum
Average proteome isoelectric point is 6.03
Get precalculated fractions of proteins

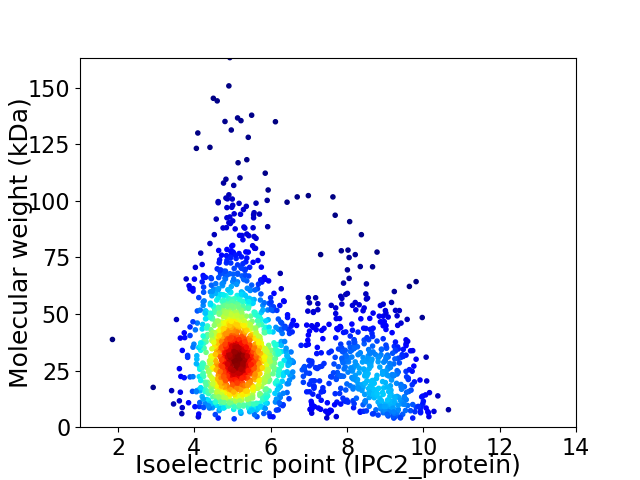
Virtual 2D-PAGE plot for 1874 proteins (isoelectric point calculated using IPC2_protein)
Get csv file with sequences according to given criteria:
* You can choose from 21 different methods for calculating isoelectric point
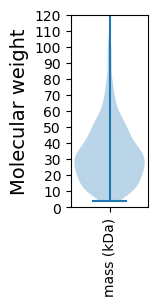
Summary statistics related to proteome-wise predictions


Protein with the lowest isoelectric point:
>tr|A0A1H9B3C8|A0A1H9B3C8_9LACT Uncharacterized protein OS=Ignavigranum ruoffiae OX=89093 GN=SAMN04488558_102151 PE=4 SV=1
MM1 pKa = 7.96DD2 pKa = 5.81AYY4 pKa = 9.49FTYY7 pKa = 10.53PEE9 pKa = 4.47LVEE12 pKa = 4.12EE13 pKa = 5.16AYY15 pKa = 10.82SFYY18 pKa = 10.85QNSDD22 pKa = 2.84IEE24 pKa = 4.2IDD26 pKa = 4.74KK27 pKa = 11.18LSLWRR32 pKa = 11.84NMVDD36 pKa = 4.96LGILDD41 pKa = 4.59GLGQPTSAAINSGLVRR57 pKa = 11.84EE58 pKa = 5.17FIEE61 pKa = 4.75EE62 pKa = 4.17EE63 pKa = 4.05NLSLAEE69 pKa = 4.11FKK71 pKa = 10.48EE72 pKa = 4.46VYY74 pKa = 9.83PVFDD78 pKa = 4.32RR79 pKa = 11.84YY80 pKa = 10.92SDD82 pKa = 3.4QFFIFQDD89 pKa = 3.96GFWQVHH95 pKa = 6.34ADD97 pKa = 4.25LLDD100 pKa = 5.05LIQIDD105 pKa = 4.2IEE107 pKa = 4.72DD108 pKa = 4.41GSLSAPEE115 pKa = 4.15VMEE118 pKa = 4.7LEE120 pKa = 5.03AYY122 pKa = 9.96FNNQIDD128 pKa = 5.68DD129 pKa = 3.71IFKK132 pKa = 10.71DD133 pKa = 3.46
MM1 pKa = 7.96DD2 pKa = 5.81AYY4 pKa = 9.49FTYY7 pKa = 10.53PEE9 pKa = 4.47LVEE12 pKa = 4.12EE13 pKa = 5.16AYY15 pKa = 10.82SFYY18 pKa = 10.85QNSDD22 pKa = 2.84IEE24 pKa = 4.2IDD26 pKa = 4.74KK27 pKa = 11.18LSLWRR32 pKa = 11.84NMVDD36 pKa = 4.96LGILDD41 pKa = 4.59GLGQPTSAAINSGLVRR57 pKa = 11.84EE58 pKa = 5.17FIEE61 pKa = 4.75EE62 pKa = 4.17EE63 pKa = 4.05NLSLAEE69 pKa = 4.11FKK71 pKa = 10.48EE72 pKa = 4.46VYY74 pKa = 9.83PVFDD78 pKa = 4.32RR79 pKa = 11.84YY80 pKa = 10.92SDD82 pKa = 3.4QFFIFQDD89 pKa = 3.96GFWQVHH95 pKa = 6.34ADD97 pKa = 4.25LLDD100 pKa = 5.05LIQIDD105 pKa = 4.2IEE107 pKa = 4.72DD108 pKa = 4.41GSLSAPEE115 pKa = 4.15VMEE118 pKa = 4.7LEE120 pKa = 5.03AYY122 pKa = 9.96FNNQIDD128 pKa = 5.68DD129 pKa = 3.71IFKK132 pKa = 10.71DD133 pKa = 3.46
Molecular weight: 15.46 kDa
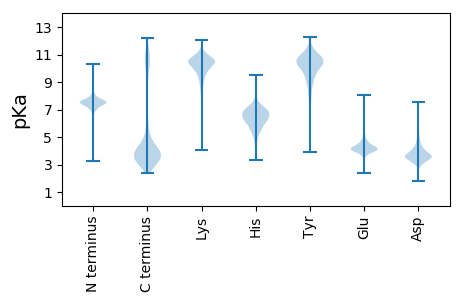
Isoelectric point according different methods:
Protein with the highest isoelectric point:
>tr|A0A1H9C3G4|A0A1H9C3G4_9LACT 50S ribosomal protein L7/L12 OS=Ignavigranum ruoffiae OX=89093 GN=rplL PE=3 SV=1
MM1 pKa = 6.99AQRR4 pKa = 11.84RR5 pKa = 11.84GGRR8 pKa = 11.84RR9 pKa = 11.84RR10 pKa = 11.84RR11 pKa = 11.84KK12 pKa = 9.16VCYY15 pKa = 9.78FCANHH20 pKa = 6.94IDD22 pKa = 3.6HH23 pKa = 7.85PDD25 pKa = 3.55YY26 pKa = 11.37KK27 pKa = 10.85DD28 pKa = 3.48VEE30 pKa = 4.21LLGRR34 pKa = 11.84FVSDD38 pKa = 3.33KK39 pKa = 11.36GKK41 pKa = 9.83ILPRR45 pKa = 11.84RR46 pKa = 11.84VTGTCAKK53 pKa = 9.56HH54 pKa = 5.56QRR56 pKa = 11.84ALTTAIKK63 pKa = 10.16RR64 pKa = 11.84ARR66 pKa = 11.84IMALLPFTVQDD77 pKa = 3.47
MM1 pKa = 6.99AQRR4 pKa = 11.84RR5 pKa = 11.84GGRR8 pKa = 11.84RR9 pKa = 11.84RR10 pKa = 11.84RR11 pKa = 11.84KK12 pKa = 9.16VCYY15 pKa = 9.78FCANHH20 pKa = 6.94IDD22 pKa = 3.6HH23 pKa = 7.85PDD25 pKa = 3.55YY26 pKa = 11.37KK27 pKa = 10.85DD28 pKa = 3.48VEE30 pKa = 4.21LLGRR34 pKa = 11.84FVSDD38 pKa = 3.33KK39 pKa = 11.36GKK41 pKa = 9.83ILPRR45 pKa = 11.84RR46 pKa = 11.84VTGTCAKK53 pKa = 9.56HH54 pKa = 5.56QRR56 pKa = 11.84ALTTAIKK63 pKa = 10.16RR64 pKa = 11.84ARR66 pKa = 11.84IMALLPFTVQDD77 pKa = 3.47
Molecular weight: 8.91 kDa
Isoelectric point according different methods:
Peptides (in silico digests for buttom-up proteomics)
Below you can find in silico digests of the whole proteome with Trypsin, Chymotrypsin, Trypsin+LysC, LysN, ArgC proteases suitable for different mass spec machines.| Try ESI |
 |
|---|
| ChTry ESI |
 |
|---|
| ArgC ESI |
 |
|---|
| LysN ESI |
 |
|---|
| TryLysC ESI |
 |
|---|
| Try MALDI |
 |
|---|
| ChTry MALDI |
 |
|---|
| ArgC MALDI |
 |
|---|
| LysN MALDI |
 |
|---|
| TryLysC MALDI |
 |
|---|
| Try LTQ |
 |
|---|
| ChTry LTQ |
 |
|---|
| ArgC LTQ |
 |
|---|
| LysN LTQ |
 |
|---|
| TryLysC LTQ |
 |
|---|
| Try MSlow |
 |
|---|
| ChTry MSlow |
 |
|---|
| ArgC MSlow |
 |
|---|
| LysN MSlow |
 |
|---|
| TryLysC MSlow |
 |
|---|
| Try MShigh |
 |
|---|
| ChTry MShigh |
 |
|---|
| ArgC MShigh |
 |
|---|
| LysN MShigh |
 |
|---|
| TryLysC MShigh |
 |
|---|
General Statistics
Number of major isoforms |
Number of additional isoforms |
Number of all proteins |
Number of amino acids |
Min. Seq. Length |
Max. Seq. Length |
Avg. Seq. Length |
Avg. Mol. Weight |
|---|---|---|---|---|---|---|---|
0 |
577246 |
32 |
1435 |
308.0 |
34.73 |
Amino acid frequency
Ala |
Cys |
Asp |
Glu |
Phe |
Gly |
His |
Ile |
Lys |
Leu |
|---|---|---|---|---|---|---|---|---|---|
7.34 ± 0.056 | 0.597 ± 0.015 |
5.72 ± 0.05 | 6.884 ± 0.065 |
4.314 ± 0.04 | 6.233 ± 0.058 |
2.077 ± 0.024 | 8.046 ± 0.063 |
5.784 ± 0.047 | 10.38 ± 0.065 |
Met |
Asn |
Gln |
Pro |
Arg |
Ser |
Thr |
Val |
Trp |
Tyr |
|---|---|---|---|---|---|---|---|---|---|
2.653 ± 0.023 | 4.523 ± 0.038 |
3.531 ± 0.031 | 5.623 ± 0.062 |
4.074 ± 0.039 | 6.02 ± 0.053 |
4.948 ± 0.038 | 6.374 ± 0.043 |
0.939 ± 0.022 | 3.939 ± 0.039 |
Most of the basic statistics you can see at this page can be downloaded from this CSV file
Proteome-pI is available under Creative Commons Attribution-NoDerivs license, for more details see here
| Reference: Kozlowski LP. Proteome-pI 2.0: Proteome Isoelectric Point Database Update. Nucleic Acids Res. 2021, doi: 10.1093/nar/gkab944 | Contact: Lukasz P. Kozlowski |
