Boseongicola aestuarii
Taxonomy: cellular organisms; Bacteria; Proteobacteria; Alphaproteobacteria; Rhodobacterales; Rhodobacteraceae; Boseongicola
Average proteome isoelectric point is 6.06
Get precalculated fractions of proteins

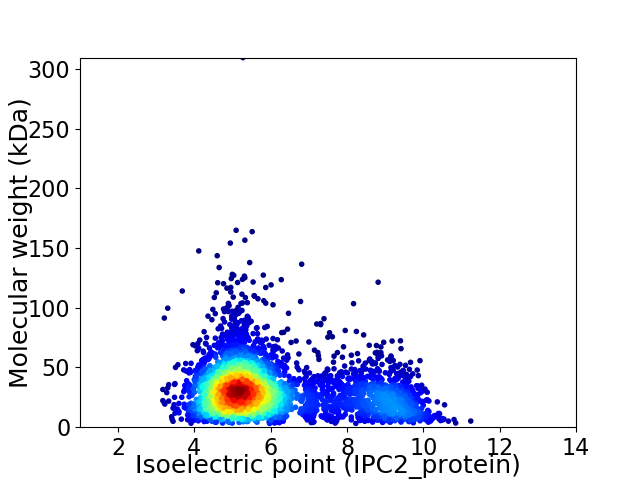
Virtual 2D-PAGE plot for 4011 proteins (isoelectric point calculated using IPC2_protein)
Get csv file with sequences according to given criteria:
* You can choose from 21 different methods for calculating isoelectric point
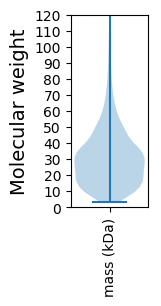
Summary statistics related to proteome-wise predictions


Protein with the lowest isoelectric point:
>tr|A0A238J391|A0A238J391_9RHOB Uncharacterized protein OS=Boseongicola aestuarii OX=1470561 GN=BOA8489_02554 PE=4 SV=1
MM1 pKa = 8.29RR2 pKa = 11.84YY3 pKa = 9.25PILAAGLLAVTPASAQDD20 pKa = 3.81LPVLTVYY27 pKa = 10.19TYY29 pKa = 11.52DD30 pKa = 4.19SFVADD35 pKa = 4.6WGPGPAIEE43 pKa = 4.32TAFEE47 pKa = 4.16ATCEE51 pKa = 4.08CDD53 pKa = 3.53LQFIAAGDD61 pKa = 3.85GAALLGRR68 pKa = 11.84VRR70 pKa = 11.84LEE72 pKa = 4.16GARR75 pKa = 11.84SDD77 pKa = 3.53ADD79 pKa = 3.13IVLGLDD85 pKa = 3.5TNLLAAANDD94 pKa = 3.76TGLFAPHH101 pKa = 6.59GLEE104 pKa = 4.42TPALDD109 pKa = 5.8LPVDD113 pKa = 3.4WSDD116 pKa = 3.68ATFLPYY122 pKa = 10.58DD123 pKa = 3.11WGYY126 pKa = 10.28FAFVHH131 pKa = 5.63NAGMEE136 pKa = 4.35NIPTDD141 pKa = 3.9FRR143 pKa = 11.84GLGASDD149 pKa = 3.56TTIVIQDD156 pKa = 3.99PRR158 pKa = 11.84SSTPGLGLLMWVKK171 pKa = 10.34AAYY174 pKa = 10.0GDD176 pKa = 3.85EE177 pKa = 4.8APGIWEE183 pKa = 3.99ALADD187 pKa = 3.76NVVTVTPGWSEE198 pKa = 4.06AYY200 pKa = 10.34GLFLEE205 pKa = 5.7GEE207 pKa = 4.19ADD209 pKa = 3.43MVLSYY214 pKa = 7.66TTSPAYY220 pKa = 10.24HH221 pKa = 7.25LIAEE225 pKa = 4.41EE226 pKa = 4.25DD227 pKa = 3.55TGKK230 pKa = 8.28TAAAFAEE237 pKa = 4.19GHH239 pKa = 5.25YY240 pKa = 10.42LQVEE244 pKa = 4.63VAGKK248 pKa = 9.47LASSDD253 pKa = 3.72QPEE256 pKa = 4.5LATAFLDD263 pKa = 5.2FMLTDD268 pKa = 4.59AFQSVIPTTNWMYY281 pKa = 9.93PAVMPEE287 pKa = 3.73GGLPEE292 pKa = 4.47GFEE295 pKa = 4.3TLIQPDD301 pKa = 3.66QALLLSPVAAAEE313 pKa = 4.2ARR315 pKa = 11.84DD316 pKa = 3.63EE317 pKa = 5.92ALDD320 pKa = 3.51EE321 pKa = 4.2WLTALSRR328 pKa = 3.8
MM1 pKa = 8.29RR2 pKa = 11.84YY3 pKa = 9.25PILAAGLLAVTPASAQDD20 pKa = 3.81LPVLTVYY27 pKa = 10.19TYY29 pKa = 11.52DD30 pKa = 4.19SFVADD35 pKa = 4.6WGPGPAIEE43 pKa = 4.32TAFEE47 pKa = 4.16ATCEE51 pKa = 4.08CDD53 pKa = 3.53LQFIAAGDD61 pKa = 3.85GAALLGRR68 pKa = 11.84VRR70 pKa = 11.84LEE72 pKa = 4.16GARR75 pKa = 11.84SDD77 pKa = 3.53ADD79 pKa = 3.13IVLGLDD85 pKa = 3.5TNLLAAANDD94 pKa = 3.76TGLFAPHH101 pKa = 6.59GLEE104 pKa = 4.42TPALDD109 pKa = 5.8LPVDD113 pKa = 3.4WSDD116 pKa = 3.68ATFLPYY122 pKa = 10.58DD123 pKa = 3.11WGYY126 pKa = 10.28FAFVHH131 pKa = 5.63NAGMEE136 pKa = 4.35NIPTDD141 pKa = 3.9FRR143 pKa = 11.84GLGASDD149 pKa = 3.56TTIVIQDD156 pKa = 3.99PRR158 pKa = 11.84SSTPGLGLLMWVKK171 pKa = 10.34AAYY174 pKa = 10.0GDD176 pKa = 3.85EE177 pKa = 4.8APGIWEE183 pKa = 3.99ALADD187 pKa = 3.76NVVTVTPGWSEE198 pKa = 4.06AYY200 pKa = 10.34GLFLEE205 pKa = 5.7GEE207 pKa = 4.19ADD209 pKa = 3.43MVLSYY214 pKa = 7.66TTSPAYY220 pKa = 10.24HH221 pKa = 7.25LIAEE225 pKa = 4.41EE226 pKa = 4.25DD227 pKa = 3.55TGKK230 pKa = 8.28TAAAFAEE237 pKa = 4.19GHH239 pKa = 5.25YY240 pKa = 10.42LQVEE244 pKa = 4.63VAGKK248 pKa = 9.47LASSDD253 pKa = 3.72QPEE256 pKa = 4.5LATAFLDD263 pKa = 5.2FMLTDD268 pKa = 4.59AFQSVIPTTNWMYY281 pKa = 9.93PAVMPEE287 pKa = 3.73GGLPEE292 pKa = 4.47GFEE295 pKa = 4.3TLIQPDD301 pKa = 3.66QALLLSPVAAAEE313 pKa = 4.2ARR315 pKa = 11.84DD316 pKa = 3.63EE317 pKa = 5.92ALDD320 pKa = 3.51EE321 pKa = 4.2WLTALSRR328 pKa = 3.8
Molecular weight: 34.93 kDa
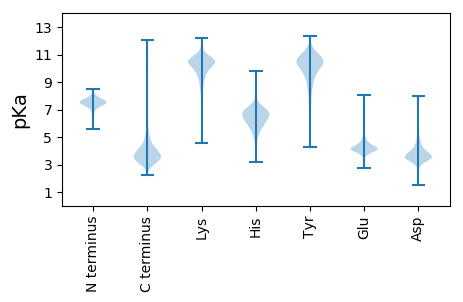
Isoelectric point according different methods:
Protein with the highest isoelectric point:
>tr|A0A238J4E7|A0A238J4E7_9RHOB Tyrosine recombinase XerC OS=Boseongicola aestuarii OX=1470561 GN=xerC_3 PE=4 SV=1
MM1 pKa = 7.45KK2 pKa = 9.61RR3 pKa = 11.84TFQPSNLVRR12 pKa = 11.84KK13 pKa = 9.18RR14 pKa = 11.84RR15 pKa = 11.84HH16 pKa = 4.42GFRR19 pKa = 11.84ARR21 pKa = 11.84MATKK25 pKa = 10.37AGRR28 pKa = 11.84KK29 pKa = 8.81IINARR34 pKa = 11.84RR35 pKa = 11.84ARR37 pKa = 11.84GRR39 pKa = 11.84KK40 pKa = 9.18SLTAA44 pKa = 4.14
MM1 pKa = 7.45KK2 pKa = 9.61RR3 pKa = 11.84TFQPSNLVRR12 pKa = 11.84KK13 pKa = 9.18RR14 pKa = 11.84RR15 pKa = 11.84HH16 pKa = 4.42GFRR19 pKa = 11.84ARR21 pKa = 11.84MATKK25 pKa = 10.37AGRR28 pKa = 11.84KK29 pKa = 8.81IINARR34 pKa = 11.84RR35 pKa = 11.84ARR37 pKa = 11.84GRR39 pKa = 11.84KK40 pKa = 9.18SLTAA44 pKa = 4.14
Molecular weight: 5.15 kDa
Isoelectric point according different methods:
Peptides (in silico digests for buttom-up proteomics)
Below you can find in silico digests of the whole proteome with Trypsin, Chymotrypsin, Trypsin+LysC, LysN, ArgC proteases suitable for different mass spec machines.| Try ESI |
 |
|---|
| ChTry ESI |
 |
|---|
| ArgC ESI |
 |
|---|
| LysN ESI |
 |
|---|
| TryLysC ESI |
 |
|---|
| Try MALDI |
 |
|---|
| ChTry MALDI |
 |
|---|
| ArgC MALDI |
 |
|---|
| LysN MALDI |
 |
|---|
| TryLysC MALDI |
 |
|---|
| Try LTQ |
 |
|---|
| ChTry LTQ |
 |
|---|
| ArgC LTQ |
 |
|---|
| LysN LTQ |
 |
|---|
| TryLysC LTQ |
 |
|---|
| Try MSlow |
 |
|---|
| ChTry MSlow |
 |
|---|
| ArgC MSlow |
 |
|---|
| LysN MSlow |
 |
|---|
| TryLysC MSlow |
 |
|---|
| Try MShigh |
 |
|---|
| ChTry MShigh |
 |
|---|
| ArgC MShigh |
 |
|---|
| LysN MShigh |
 |
|---|
| TryLysC MShigh |
 |
|---|
General Statistics
Number of major isoforms |
Number of additional isoforms |
Number of all proteins |
Number of amino acids |
Min. Seq. Length |
Max. Seq. Length |
Avg. Seq. Length |
Avg. Mol. Weight |
|---|---|---|---|---|---|---|---|
0 |
1184372 |
29 |
2802 |
295.3 |
32.11 |
Amino acid frequency
Ala |
Cys |
Asp |
Glu |
Phe |
Gly |
His |
Ile |
Lys |
Leu |
|---|---|---|---|---|---|---|---|---|---|
11.795 ± 0.045 | 0.886 ± 0.013 |
6.093 ± 0.04 | 5.961 ± 0.036 |
3.995 ± 0.031 | 8.49 ± 0.036 |
1.999 ± 0.02 | 5.566 ± 0.031 |
3.364 ± 0.032 | 9.842 ± 0.051 |
Met |
Asn |
Gln |
Pro |
Arg |
Ser |
Thr |
Val |
Trp |
Tyr |
|---|---|---|---|---|---|---|---|---|---|
2.76 ± 0.02 | 2.79 ± 0.02 |
4.865 ± 0.025 | 2.939 ± 0.019 |
6.418 ± 0.037 | 5.532 ± 0.029 |
5.595 ± 0.027 | 7.469 ± 0.032 |
1.418 ± 0.018 | 2.222 ± 0.016 |
Most of the basic statistics you can see at this page can be downloaded from this CSV file
Proteome-pI is available under Creative Commons Attribution-NoDerivs license, for more details see here
| Reference: Kozlowski LP. Proteome-pI 2.0: Proteome Isoelectric Point Database Update. Nucleic Acids Res. 2021, doi: 10.1093/nar/gkab944 | Contact: Lukasz P. Kozlowski |
