Streptococcus satellite phage Javan759
Taxonomy: Viruses; unclassified bacterial viruses
Average proteome isoelectric point is 6.57
Get precalculated fractions of proteins
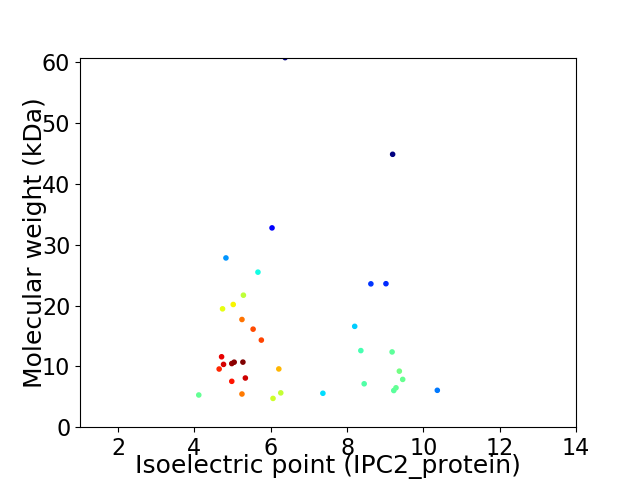
Virtual 2D-PAGE plot for 36 proteins (isoelectric point calculated using IPC2_protein)
Get csv file with sequences according to given criteria:
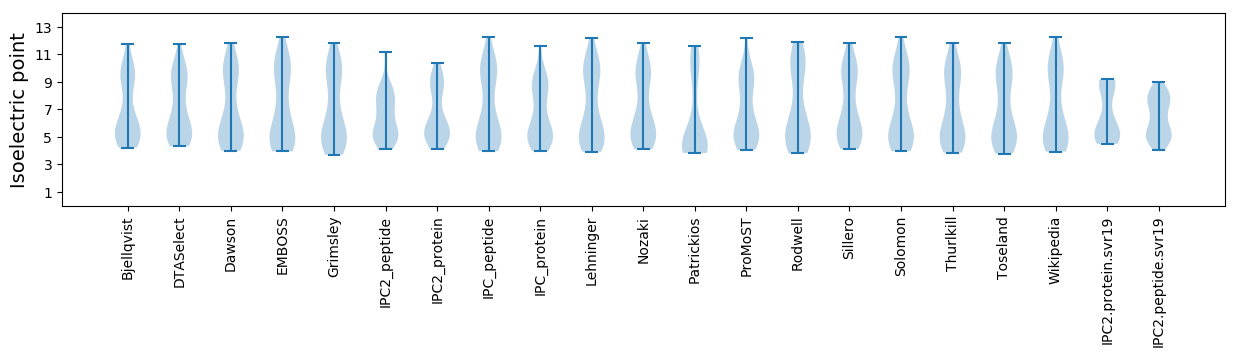
* You can choose from 21 different methods for calculating isoelectric point
Summary statistics related to proteome-wise predictions
Protein with the lowest isoelectric point:
>tr|A0A4D5ZW71|A0A4D5ZW71_9VIRU Uncharacterized protein OS=Streptococcus satellite phage Javan759 OX=2558854 GN=JavanS759_0020 PE=4 SV=1
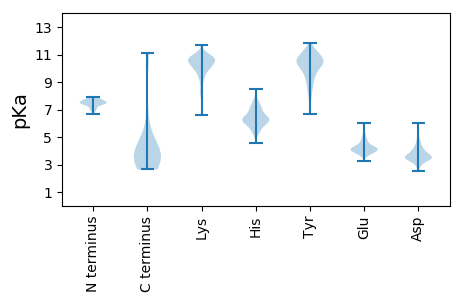
MM1 pKa = 7.68ILDD4 pKa = 4.62LGKK7 pKa = 8.39MTQAEE12 pKa = 4.45FDD14 pKa = 3.72EE15 pKa = 4.66VMADD19 pKa = 3.21IKK21 pKa = 11.13ARR23 pKa = 11.84NPNLLQLITDD33 pKa = 4.52FLDD36 pKa = 3.62RR37 pKa = 11.84KK38 pKa = 8.24VTPEE42 pKa = 4.05EE43 pKa = 3.86VDD45 pKa = 3.54DD46 pKa = 4.24
MM1 pKa = 7.68ILDD4 pKa = 4.62LGKK7 pKa = 8.39MTQAEE12 pKa = 4.45FDD14 pKa = 3.72EE15 pKa = 4.66VMADD19 pKa = 3.21IKK21 pKa = 11.13ARR23 pKa = 11.84NPNLLQLITDD33 pKa = 4.52FLDD36 pKa = 3.62RR37 pKa = 11.84KK38 pKa = 8.24VTPEE42 pKa = 4.05EE43 pKa = 3.86VDD45 pKa = 3.54DD46 pKa = 4.24
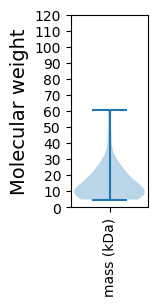
Molecular weight: 5.29 kDa
Isoelectric point according different methods:
Protein with the highest isoelectric point:
>tr|A0A4D5ZW57|A0A4D5ZW57_9VIRU Uncharacterized protein OS=Streptococcus satellite phage Javan759 OX=2558854 GN=JavanS759_0018 PE=4 SV=1
MM1 pKa = 7.47YY2 pKa = 9.76EE3 pKa = 3.84RR4 pKa = 11.84FYY6 pKa = 10.83ISSKK10 pKa = 10.22SEE12 pKa = 3.4SWLLSGCFLSFFCLFFRR29 pKa = 11.84SWQPRR34 pKa = 11.84FFRR37 pKa = 11.84SLHH40 pKa = 5.57INVGKK45 pKa = 10.62SRR47 pKa = 11.84IFKK50 pKa = 8.87NTGKK54 pKa = 10.12KK55 pKa = 9.47QFSSFSEE62 pKa = 4.18SLKK65 pKa = 10.83SDD67 pKa = 3.09GVNNSNPVSISSS79 pKa = 3.36
MM1 pKa = 7.47YY2 pKa = 9.76EE3 pKa = 3.84RR4 pKa = 11.84FYY6 pKa = 10.83ISSKK10 pKa = 10.22SEE12 pKa = 3.4SWLLSGCFLSFFCLFFRR29 pKa = 11.84SWQPRR34 pKa = 11.84FFRR37 pKa = 11.84SLHH40 pKa = 5.57INVGKK45 pKa = 10.62SRR47 pKa = 11.84IFKK50 pKa = 8.87NTGKK54 pKa = 10.12KK55 pKa = 9.47QFSSFSEE62 pKa = 4.18SLKK65 pKa = 10.83SDD67 pKa = 3.09GVNNSNPVSISSS79 pKa = 3.36
Molecular weight: 9.21 kDa
Isoelectric point according different methods:
Peptides (in silico digests for buttom-up proteomics)
Below you can find in silico digests of the whole proteome with Trypsin, Chymotrypsin, Trypsin+LysC, LysN, ArgC proteases suitable for different mass spec machines.| Try ESI |
 |
|---|
| ChTry ESI |
|
|---|
| ArgC ESI |
|
|---|
| LysN ESI |
|
|---|
| TryLysC ESI |
|
|---|
| Try MALDI |
|
|---|
| ChTry MALDI |
|
|---|
| ArgC MALDI |
|
|---|
| LysN MALDI |
|
|---|
| TryLysC MALDI |
|
|---|
| Try LTQ |
|
|---|
| ChTry LTQ |
|
|---|
| ArgC LTQ |
|
|---|
| LysN LTQ |
|
|---|
| TryLysC LTQ |
|
|---|
| Try MSlow |
|
|---|
| ChTry MSlow |
|
|---|
| ArgC MSlow |
|
|---|
| LysN MSlow |
|
|---|
| TryLysC MSlow |
|
|---|
| Try MShigh |
|
|---|
| ChTry MShigh |
|
|---|
| ArgC MShigh |
|
|---|
| LysN MShigh |
|
|---|
| TryLysC MShigh |
|
|---|
General Statistics
Number of major isoforms |
Number of additional isoforms |
Number of all proteins |
Number of amino acids |
Min. Seq. Length |
Max. Seq. Length |
Avg. Seq. Length |
Avg. Mol. Weight |
|---|---|---|---|---|---|---|---|
0 |
4743 |
40 |
521 |
131.8 |
15.21 |
Amino acid frequency
Ala |
Cys |
Asp |
Glu |
Phe |
Gly |
His |
Ile |
Lys |
Leu |
|---|---|---|---|---|---|---|---|---|---|
5.798 ± 0.299 | 0.738 ± 0.148 |
5.714 ± 0.369 | 8.644 ± 0.551 |
4.111 ± 0.317 | 4.702 ± 0.341 |
1.434 ± 0.206 | 6.873 ± 0.314 |
9.256 ± 0.451 | 10.458 ± 0.373 |
Met |
Asn |
Gln |
Pro |
Arg |
Ser |
Thr |
Val |
Trp |
Tyr |
|---|---|---|---|---|---|---|---|---|---|
2.467 ± 0.197 | 5.313 ± 0.344 |
2.804 ± 0.265 | 3.711 ± 0.256 |
5.376 ± 0.373 | 5.756 ± 0.427 |
6.114 ± 0.445 | 5.566 ± 0.396 |
1.012 ± 0.168 | 4.153 ± 0.251 |
Most of the basic statistics you can see at this page can be downloaded from this CSV file
See this proteome in:

Proteome-pI is available under Creative Commons Attribution-NoDerivs license, for more details see here
| Reference: Kozlowski LP. Proteome-pI 2.0: Proteome Isoelectric Point Database Update. Nucleic Acids Res. 2021, doi: 10.1093/nar/gkab944 | Contact: Lukasz P. Kozlowski |