Broad bean necrosis virus
Taxonomy: Viruses; Riboviria; Orthornavirae; Kitrinoviricota; Alsuviricetes; Martellivirales; Virgaviridae; Pomovirus
Average proteome isoelectric point is 7.18
Get precalculated fractions of proteins

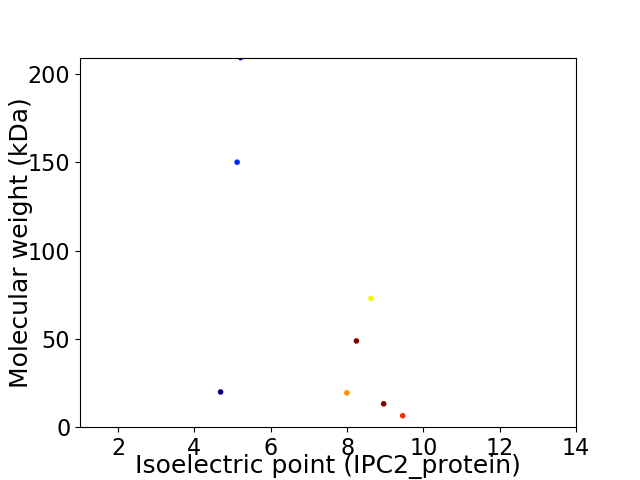
Virtual 2D-PAGE plot for 8 proteins (isoelectric point calculated using IPC2_protein)
Get csv file with sequences according to given criteria:
* You can choose from 21 different methods for calculating isoelectric point
Summary statistics related to proteome-wise predictions


Protein with the lowest isoelectric point:
>tr|Q9YPH2|Q9YPH2_9VIRU Triple-gene-block second protein OS=Broad bean necrosis virus OX=79918 PE=4 SV=1
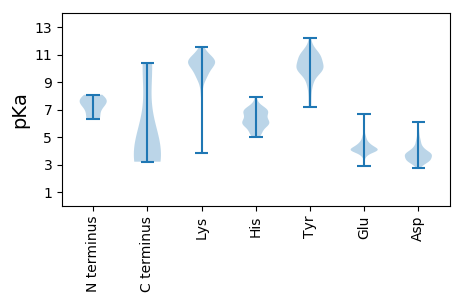
MM1 pKa = 8.07DD2 pKa = 5.53PPVIINSRR10 pKa = 11.84DD11 pKa = 3.72CSCQHH16 pKa = 6.74CYY18 pKa = 10.44LPQRR22 pKa = 11.84CSHH25 pKa = 6.38SSGSVSQDD33 pKa = 2.86VQSPVEE39 pKa = 4.34EE40 pKa = 3.91IVQIVSNRR48 pKa = 11.84EE49 pKa = 3.98SVFDD53 pKa = 3.73SYY55 pKa = 12.1YY56 pKa = 11.45LLICCSVCFILGLSIMLFINNLYY79 pKa = 9.38FRR81 pKa = 11.84NVSSVGGSYY90 pKa = 10.73YY91 pKa = 10.74YY92 pKa = 10.57QDD94 pKa = 4.28LNSVEE99 pKa = 4.45YY100 pKa = 10.34KK101 pKa = 10.56SSGPIDD107 pKa = 3.87ADD109 pKa = 3.6VIEE112 pKa = 5.62RR113 pKa = 11.84IHH115 pKa = 6.78HH116 pKa = 5.78FQQGPLGRR124 pKa = 11.84FKK126 pKa = 11.26DD127 pKa = 3.76DD128 pKa = 2.76ATFAIKK134 pKa = 10.53VKK136 pKa = 10.51EE137 pKa = 3.9DD138 pKa = 3.92DD139 pKa = 3.99FFEE142 pKa = 4.66DD143 pKa = 3.67AVDD146 pKa = 3.36IRR148 pKa = 11.84EE149 pKa = 4.03TSLFISDD156 pKa = 3.85KK157 pKa = 9.76VVSFVFIIILILLLKK172 pKa = 9.86VCYY175 pKa = 10.1GG176 pKa = 3.41
MM1 pKa = 8.07DD2 pKa = 5.53PPVIINSRR10 pKa = 11.84DD11 pKa = 3.72CSCQHH16 pKa = 6.74CYY18 pKa = 10.44LPQRR22 pKa = 11.84CSHH25 pKa = 6.38SSGSVSQDD33 pKa = 2.86VQSPVEE39 pKa = 4.34EE40 pKa = 3.91IVQIVSNRR48 pKa = 11.84EE49 pKa = 3.98SVFDD53 pKa = 3.73SYY55 pKa = 12.1YY56 pKa = 11.45LLICCSVCFILGLSIMLFINNLYY79 pKa = 9.38FRR81 pKa = 11.84NVSSVGGSYY90 pKa = 10.73YY91 pKa = 10.74YY92 pKa = 10.57QDD94 pKa = 4.28LNSVEE99 pKa = 4.45YY100 pKa = 10.34KK101 pKa = 10.56SSGPIDD107 pKa = 3.87ADD109 pKa = 3.6VIEE112 pKa = 5.62RR113 pKa = 11.84IHH115 pKa = 6.78HH116 pKa = 5.78FQQGPLGRR124 pKa = 11.84FKK126 pKa = 11.26DD127 pKa = 3.76DD128 pKa = 2.76ATFAIKK134 pKa = 10.53VKK136 pKa = 10.51EE137 pKa = 3.9DD138 pKa = 3.92DD139 pKa = 3.99FFEE142 pKa = 4.66DD143 pKa = 3.67AVDD146 pKa = 3.36IRR148 pKa = 11.84EE149 pKa = 4.03TSLFISDD156 pKa = 3.85KK157 pKa = 9.76VVSFVFIIILILLLKK172 pKa = 9.86VCYY175 pKa = 10.1GG176 pKa = 3.41
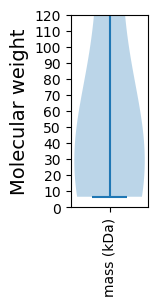
Molecular weight: 19.95 kDa
Isoelectric point according different methods:
Protein with the highest isoelectric point:
>tr|Q9YPH3|Q9YPH3_9VIRU Triple-gene-block first protein (Fragment) OS=Broad bean necrosis virus OX=79918 PE=4 SV=1
MM1 pKa = 6.98VRR3 pKa = 11.84SNEE6 pKa = 3.76IGSRR10 pKa = 11.84PNKK13 pKa = 9.18YY14 pKa = 8.8WPILFGVSAICFFLFLGVTNQNIPHH39 pKa = 6.25NHH41 pKa = 6.59HH42 pKa = 7.07GDD44 pKa = 3.95NIHH47 pKa = 6.59KK48 pKa = 9.97FSNGGKK54 pKa = 9.09YY55 pKa = 9.21QDD57 pKa = 3.17GTKK60 pKa = 10.25RR61 pKa = 11.84INYY64 pKa = 7.3NANNSRR70 pKa = 11.84AYY72 pKa = 10.54NGSSSNNQFKK82 pKa = 11.09GLFLPALLFTAAMLAFQWFSKK103 pKa = 10.11SRR105 pKa = 11.84CPVTCRR111 pKa = 11.84GDD113 pKa = 3.63CANCQQ118 pKa = 3.21
MM1 pKa = 6.98VRR3 pKa = 11.84SNEE6 pKa = 3.76IGSRR10 pKa = 11.84PNKK13 pKa = 9.18YY14 pKa = 8.8WPILFGVSAICFFLFLGVTNQNIPHH39 pKa = 6.25NHH41 pKa = 6.59HH42 pKa = 7.07GDD44 pKa = 3.95NIHH47 pKa = 6.59KK48 pKa = 9.97FSNGGKK54 pKa = 9.09YY55 pKa = 9.21QDD57 pKa = 3.17GTKK60 pKa = 10.25RR61 pKa = 11.84INYY64 pKa = 7.3NANNSRR70 pKa = 11.84AYY72 pKa = 10.54NGSSSNNQFKK82 pKa = 11.09GLFLPALLFTAAMLAFQWFSKK103 pKa = 10.11SRR105 pKa = 11.84CPVTCRR111 pKa = 11.84GDD113 pKa = 3.63CANCQQ118 pKa = 3.21
Molecular weight: 13.26 kDa
Isoelectric point according different methods:
Peptides (in silico digests for buttom-up proteomics)
Below you can find in silico digests of the whole proteome with Trypsin, Chymotrypsin, Trypsin+LysC, LysN, ArgC proteases suitable for different mass spec machines.| Try ESI |
 |
|---|
| ChTry ESI |
 |
|---|
| ArgC ESI |
 |
|---|
| LysN ESI |
 |
|---|
| TryLysC ESI |
 |
|---|
| Try MALDI |
 |
|---|
| ChTry MALDI |
 |
|---|
| ArgC MALDI |
 |
|---|
| LysN MALDI |
 |
|---|
| TryLysC MALDI |
 |
|---|
| Try LTQ |
 |
|---|
| ChTry LTQ |
 |
|---|
| ArgC LTQ |
 |
|---|
| LysN LTQ |
 |
|---|
| TryLysC LTQ |
 |
|---|
| Try MSlow |
 |
|---|
| ChTry MSlow |
 |
|---|
| ArgC MSlow |
 |
|---|
| LysN MSlow |
 |
|---|
| TryLysC MSlow |
 |
|---|
| Try MShigh |
 |
|---|
| ChTry MShigh |
 |
|---|
| ArgC MShigh |
 |
|---|
| LysN MShigh |
 |
|---|
| TryLysC MShigh |
 |
|---|
General Statistics
Number of major isoforms |
Number of additional isoforms |
Number of all proteins |
Number of amino acids |
Min. Seq. Length |
Max. Seq. Length |
Avg. Seq. Length |
Avg. Mol. Weight |
|---|---|---|---|---|---|---|---|
0 |
4742 |
60 |
1821 |
592.8 |
67.55 |
Amino acid frequency
Ala |
Cys |
Asp |
Glu |
Phe |
Gly |
His |
Ile |
Lys |
Leu |
|---|---|---|---|---|---|---|---|---|---|
5.947 ± 0.505 | 2.13 ± 0.34 |
6.369 ± 0.692 | 7.465 ± 0.87 |
4.407 ± 0.328 | 5.272 ± 0.586 |
1.792 ± 0.219 | 6.284 ± 0.585 |
7.381 ± 0.603 | 8.962 ± 0.681 |
Met |
Asn |
Gln |
Pro |
Arg |
Ser |
Thr |
Val |
Trp |
Tyr |
|---|---|---|---|---|---|---|---|---|---|
2.889 ± 0.47 | 5.293 ± 0.441 |
3.016 ± 0.225 | 3.48 ± 0.209 |
5.293 ± 0.267 | 7.339 ± 0.502 |
5.082 ± 0.318 | 6.664 ± 0.298 |
1.202 ± 0.13 | 3.69 ± 0.359 |
Most of the basic statistics you can see at this page can be downloaded from this CSV file
Proteome-pI is available under Creative Commons Attribution-NoDerivs license, for more details see here
| Reference: Kozlowski LP. Proteome-pI 2.0: Proteome Isoelectric Point Database Update. Nucleic Acids Res. 2021, doi: 10.1093/nar/gkab944 | Contact: Lukasz P. Kozlowski |
