Ipomoea nil (Japanese morning glory) (Pharbitis nil)
Taxonomy: cellular organisms; Eukaryota; Viridiplantae; Streptophyta; Streptophytina; Embryophyta; Tracheophyta; Euphyllophyta; Spermatophyta; Magnoliopsida; Mesangiospermae; eudicotyledons; Gunneridae; Pentapetalae; asterids; lamiids; Solanales; Convolvulaceae; Ipomoeeae; Ipomoea
Average proteome isoelectric point is 7.45
Get precalculated fractions of proteins

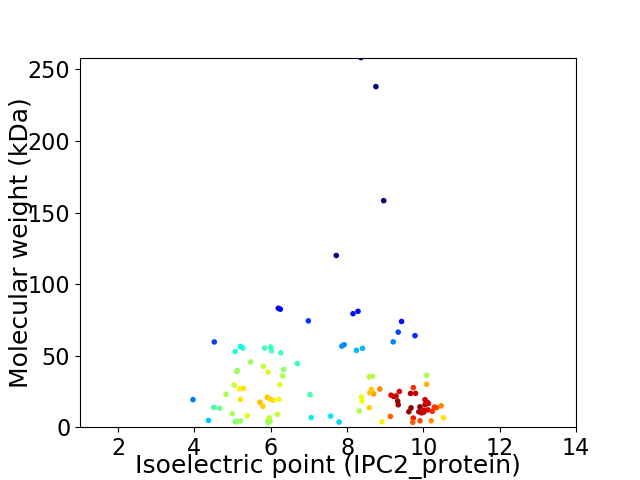
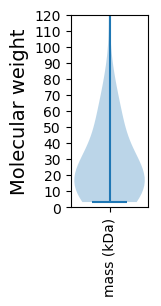
Virtual 2D-PAGE plot for 109 proteins (isoelectric point calculated using IPC2_protein)
Get csv file with sequences according to given criteria:
* You can choose from 21 different methods for calculating isoelectric point
Summary statistics related to proteome-wise predictions


Protein with the lowest isoelectric point:
>tr|U3R2T1|U3R2T1_IPONI Cytochrome b6-f complex subunit 5 OS=Ipomoea nil OX=35883 GN=petG PE=3 SV=1
MM1 pKa = 7.98DD2 pKa = 5.22LPGPIHH8 pKa = 7.65DD9 pKa = 4.5FLLVFLGSGLILGSIGVVLFPNPIYY34 pKa = 10.75SAFSLGLVLVCISLFYY50 pKa = 10.63ILSNSYY56 pKa = 9.81FVAAAQLLIYY66 pKa = 10.36VGAINVLILFAVMFLNGSEE85 pKa = 4.15YY86 pKa = 11.32SNDD89 pKa = 3.22FPLWTLGDD97 pKa = 4.69GITSQVCISLFISLISTILDD117 pKa = 3.58TSWYY121 pKa = 9.51GIIWTTRR128 pKa = 11.84SNQIIEE134 pKa = 4.03QDD136 pKa = 4.35LISNSQQIGIHH147 pKa = 6.4LSTDD151 pKa = 4.05FFLPFEE157 pKa = 5.24LISIILLVALIGAIVIARR175 pKa = 11.84QQ176 pKa = 2.99
MM1 pKa = 7.98DD2 pKa = 5.22LPGPIHH8 pKa = 7.65DD9 pKa = 4.5FLLVFLGSGLILGSIGVVLFPNPIYY34 pKa = 10.75SAFSLGLVLVCISLFYY50 pKa = 10.63ILSNSYY56 pKa = 9.81FVAAAQLLIYY66 pKa = 10.36VGAINVLILFAVMFLNGSEE85 pKa = 4.15YY86 pKa = 11.32SNDD89 pKa = 3.22FPLWTLGDD97 pKa = 4.69GITSQVCISLFISLISTILDD117 pKa = 3.58TSWYY121 pKa = 9.51GIIWTTRR128 pKa = 11.84SNQIIEE134 pKa = 4.03QDD136 pKa = 4.35LISNSQQIGIHH147 pKa = 6.4LSTDD151 pKa = 4.05FFLPFEE157 pKa = 5.24LISIILLVALIGAIVIARR175 pKa = 11.84QQ176 pKa = 2.99
Molecular weight: 19.27 kDa
Isoelectric point according different methods:
Protein with the highest isoelectric point:
>tr|A0A1B4ZB18|A0A1B4ZB18_IPONI Ribosomal protein S1 OS=Ipomoea nil OX=35883 GN=rps1 PE=4 SV=1
MM1 pKa = 7.4SLSLLQPYY9 pKa = 10.5FLMSKK14 pKa = 7.59TRR16 pKa = 11.84SYY18 pKa = 11.83AKK20 pKa = 10.06ILIGSRR26 pKa = 11.84LFLTAMAIHH35 pKa = 6.84LSLRR39 pKa = 11.84VAPLDD44 pKa = 3.69LQQGGNSRR52 pKa = 11.84ILYY55 pKa = 7.65VHH57 pKa = 6.4VPAARR62 pKa = 11.84MSILVYY68 pKa = 10.27IVTAINTFLFLLTKK82 pKa = 10.41HH83 pKa = 6.2PLFLRR88 pKa = 11.84SSGTGIEE95 pKa = 4.0MGAFSTLFTLVTGGFRR111 pKa = 11.84GRR113 pKa = 11.84PMWGTFWVWDD123 pKa = 3.63ARR125 pKa = 11.84LTSVFILFLIYY136 pKa = 10.54LGALRR141 pKa = 11.84FQKK144 pKa = 10.7LPVEE148 pKa = 4.25PAPISIRR155 pKa = 11.84AGPIDD160 pKa = 3.49IPIIKK165 pKa = 10.39SSVNWWNTLHH175 pKa = 6.14QPGSISRR182 pKa = 11.84SGTSIHH188 pKa = 6.5VPMPIPILSNFANSPFSTRR207 pKa = 11.84ILFVLEE213 pKa = 3.8TRR215 pKa = 11.84LPIPSFLEE223 pKa = 4.05SPLTEE228 pKa = 4.55EE229 pKa = 3.87IEE231 pKa = 4.1KK232 pKa = 10.51RR233 pKa = 11.84IPKK236 pKa = 9.56PSSLAEE242 pKa = 4.04SLCIHH247 pKa = 6.9GG248 pKa = 4.82
MM1 pKa = 7.4SLSLLQPYY9 pKa = 10.5FLMSKK14 pKa = 7.59TRR16 pKa = 11.84SYY18 pKa = 11.83AKK20 pKa = 10.06ILIGSRR26 pKa = 11.84LFLTAMAIHH35 pKa = 6.84LSLRR39 pKa = 11.84VAPLDD44 pKa = 3.69LQQGGNSRR52 pKa = 11.84ILYY55 pKa = 7.65VHH57 pKa = 6.4VPAARR62 pKa = 11.84MSILVYY68 pKa = 10.27IVTAINTFLFLLTKK82 pKa = 10.41HH83 pKa = 6.2PLFLRR88 pKa = 11.84SSGTGIEE95 pKa = 4.0MGAFSTLFTLVTGGFRR111 pKa = 11.84GRR113 pKa = 11.84PMWGTFWVWDD123 pKa = 3.63ARR125 pKa = 11.84LTSVFILFLIYY136 pKa = 10.54LGALRR141 pKa = 11.84FQKK144 pKa = 10.7LPVEE148 pKa = 4.25PAPISIRR155 pKa = 11.84AGPIDD160 pKa = 3.49IPIIKK165 pKa = 10.39SSVNWWNTLHH175 pKa = 6.14QPGSISRR182 pKa = 11.84SGTSIHH188 pKa = 6.5VPMPIPILSNFANSPFSTRR207 pKa = 11.84ILFVLEE213 pKa = 3.8TRR215 pKa = 11.84LPIPSFLEE223 pKa = 4.05SPLTEE228 pKa = 4.55EE229 pKa = 3.87IEE231 pKa = 4.1KK232 pKa = 10.51RR233 pKa = 11.84IPKK236 pKa = 9.56PSSLAEE242 pKa = 4.04SLCIHH247 pKa = 6.9GG248 pKa = 4.82
Molecular weight: 27.65 kDa
Isoelectric point according different methods:
Peptides (in silico digests for buttom-up proteomics)
Below you can find in silico digests of the whole proteome with Trypsin, Chymotrypsin, Trypsin+LysC, LysN, ArgC proteases suitable for different mass spec machines.| Try ESI |
 |
|---|
| ChTry ESI |
 |
|---|
| ArgC ESI |
 |
|---|
| LysN ESI |
 |
|---|
| TryLysC ESI |
 |
|---|
| Try MALDI |
 |
|---|
| ChTry MALDI |
 |
|---|
| ArgC MALDI |
 |
|---|
| LysN MALDI |
 |
|---|
| TryLysC MALDI |
 |
|---|
| Try LTQ |
 |
|---|
| ChTry LTQ |
 |
|---|
| ArgC LTQ |
 |
|---|
| LysN LTQ |
 |
|---|
| TryLysC LTQ |
 |
|---|
| Try MSlow |
 |
|---|
| ChTry MSlow |
 |
|---|
| ArgC MSlow |
 |
|---|
| LysN MSlow |
 |
|---|
| TryLysC MSlow |
 |
|---|
| Try MShigh |
 |
|---|
| ChTry MShigh |
 |
|---|
| ArgC MShigh |
 |
|---|
| LysN MShigh |
 |
|---|
| TryLysC MShigh |
 |
|---|
General Statistics
Number of major isoforms |
Number of additional isoforms |
Number of all proteins |
Number of amino acids |
Min. Seq. Length |
Max. Seq. Length |
Avg. Seq. Length |
Avg. Mol. Weight |
|---|---|---|---|---|---|---|---|
31905 |
29 |
2201 |
292.7 |
33.18 |
Amino acid frequency
Ala |
Cys |
Asp |
Glu |
Phe |
Gly |
His |
Ile |
Lys |
Leu |
|---|---|---|---|---|---|---|---|---|---|
5.927 ± 0.389 | 1.241 ± 0.077 |
3.78 ± 0.172 | 5.112 ± 0.363 |
6.034 ± 0.322 | 6.858 ± 0.383 |
2.357 ± 0.158 | 8.215 ± 0.231 |
5.168 ± 0.507 | 10.44 ± 0.286 |
Met |
Asn |
Gln |
Pro |
Arg |
Ser |
Thr |
Val |
Trp |
Tyr |
|---|---|---|---|---|---|---|---|---|---|
2.376 ± 0.119 | 4.263 ± 0.285 |
4.454 ± 0.15 | 3.485 ± 0.158 |
6.24 ± 0.286 | 8.118 ± 0.311 |
5.225 ± 0.143 | 5.673 ± 0.283 |
1.617 ± 0.12 | 3.416 ± 0.102 |
Most of the basic statistics you can see at this page can be downloaded from this CSV file
Proteome-pI is available under Creative Commons Attribution-NoDerivs license, for more details see here
| Reference: Kozlowski LP. Proteome-pI 2.0: Proteome Isoelectric Point Database Update. Nucleic Acids Res. 2021, doi: 10.1093/nar/gkab944 | Contact: Lukasz P. Kozlowski |
