Winogradskyella aurantia
Taxonomy: cellular organisms; Bacteria; FCB group; Bacteroidetes/Chlorobi group; Bacteroidetes; Flavobacteriia; Flavobacteriales; Flavobacteriaceae; Winogradskyella
Average proteome isoelectric point is 6.5
Get precalculated fractions of proteins

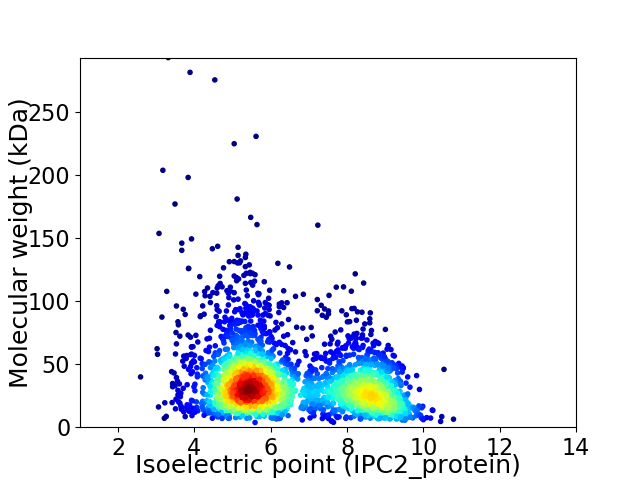
Virtual 2D-PAGE plot for 2856 proteins (isoelectric point calculated using IPC2_protein)
Get csv file with sequences according to given criteria:
* You can choose from 21 different methods for calculating isoelectric point
Summary statistics related to proteome-wise predictions


Protein with the lowest isoelectric point:
>tr|A0A265UPP2|A0A265UPP2_9FLAO Uncharacterized protein OS=Winogradskyella aurantia OX=1915063 GN=CA834_13060 PE=4 SV=1
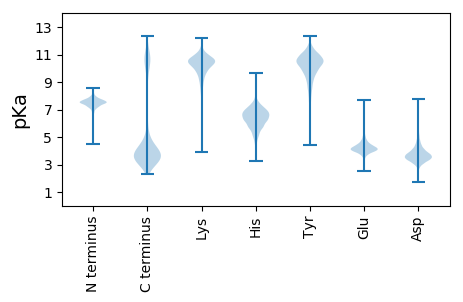
MM1 pKa = 7.55KK2 pKa = 10.19NYY4 pKa = 10.15IKK6 pKa = 9.6ITIVAVLCLFIQACQEE22 pKa = 3.72EE23 pKa = 4.65DD24 pKa = 3.48QEE26 pKa = 4.53FGPVVAPTNIDD37 pKa = 3.48LQLTYY42 pKa = 10.76LDD44 pKa = 5.82DD45 pKa = 4.35IDD47 pKa = 5.97GDD49 pKa = 4.34GVLDD53 pKa = 3.93EE54 pKa = 4.73VDD56 pKa = 3.9APGLGSGFVKK66 pKa = 9.49FTATADD72 pKa = 3.48NALSFVYY79 pKa = 9.76EE80 pKa = 4.15VNNIRR85 pKa = 11.84TTAVNGKK92 pKa = 8.24ATLVFSTLGLNTYY105 pKa = 9.44NATVIAYY112 pKa = 6.97GTGGASSSQTIQLDD126 pKa = 3.64VLSTFEE132 pKa = 4.46VPAEE136 pKa = 4.65LITMLTNDD144 pKa = 3.45SQRR147 pKa = 11.84TWRR150 pKa = 11.84IKK152 pKa = 11.05AEE154 pKa = 4.24VNNHH158 pKa = 6.31FGLGPVGGGFNEE170 pKa = 4.9FFQAPAFDD178 pKa = 4.03KK179 pKa = 10.83EE180 pKa = 4.61GVGMYY185 pKa = 10.2DD186 pKa = 3.26DD187 pKa = 5.7RR188 pKa = 11.84YY189 pKa = 10.27IFNVDD194 pKa = 2.96GTFTHH199 pKa = 6.5ITDD202 pKa = 4.01NTNDD206 pKa = 3.92DD207 pKa = 3.98PDD209 pKa = 4.06VNPEE213 pKa = 3.66GTVFGRR219 pKa = 11.84EE220 pKa = 3.91VLIDD224 pKa = 3.76EE225 pKa = 4.92LNGPGSGTSNGADD238 pKa = 2.88IEE240 pKa = 4.36NYY242 pKa = 9.68PYY244 pKa = 10.96SDD246 pKa = 3.93YY247 pKa = 11.36SEE249 pKa = 4.23SWFITGPGGVEE260 pKa = 3.96TLNLTGIGFLGYY272 pKa = 8.53YY273 pKa = 9.35TGGDD277 pKa = 3.01HH278 pKa = 6.95TYY280 pKa = 9.94IIEE283 pKa = 4.11SRR285 pKa = 11.84SINEE289 pKa = 3.85MVVRR293 pKa = 11.84TTDD296 pKa = 3.2GNGEE300 pKa = 4.08FDD302 pKa = 3.02WGFILIADD310 pKa = 4.13EE311 pKa = 4.21
MM1 pKa = 7.55KK2 pKa = 10.19NYY4 pKa = 10.15IKK6 pKa = 9.6ITIVAVLCLFIQACQEE22 pKa = 3.72EE23 pKa = 4.65DD24 pKa = 3.48QEE26 pKa = 4.53FGPVVAPTNIDD37 pKa = 3.48LQLTYY42 pKa = 10.76LDD44 pKa = 5.82DD45 pKa = 4.35IDD47 pKa = 5.97GDD49 pKa = 4.34GVLDD53 pKa = 3.93EE54 pKa = 4.73VDD56 pKa = 3.9APGLGSGFVKK66 pKa = 9.49FTATADD72 pKa = 3.48NALSFVYY79 pKa = 9.76EE80 pKa = 4.15VNNIRR85 pKa = 11.84TTAVNGKK92 pKa = 8.24ATLVFSTLGLNTYY105 pKa = 9.44NATVIAYY112 pKa = 6.97GTGGASSSQTIQLDD126 pKa = 3.64VLSTFEE132 pKa = 4.46VPAEE136 pKa = 4.65LITMLTNDD144 pKa = 3.45SQRR147 pKa = 11.84TWRR150 pKa = 11.84IKK152 pKa = 11.05AEE154 pKa = 4.24VNNHH158 pKa = 6.31FGLGPVGGGFNEE170 pKa = 4.9FFQAPAFDD178 pKa = 4.03KK179 pKa = 10.83EE180 pKa = 4.61GVGMYY185 pKa = 10.2DD186 pKa = 3.26DD187 pKa = 5.7RR188 pKa = 11.84YY189 pKa = 10.27IFNVDD194 pKa = 2.96GTFTHH199 pKa = 6.5ITDD202 pKa = 4.01NTNDD206 pKa = 3.92DD207 pKa = 3.98PDD209 pKa = 4.06VNPEE213 pKa = 3.66GTVFGRR219 pKa = 11.84EE220 pKa = 3.91VLIDD224 pKa = 3.76EE225 pKa = 4.92LNGPGSGTSNGADD238 pKa = 2.88IEE240 pKa = 4.36NYY242 pKa = 9.68PYY244 pKa = 10.96SDD246 pKa = 3.93YY247 pKa = 11.36SEE249 pKa = 4.23SWFITGPGGVEE260 pKa = 3.96TLNLTGIGFLGYY272 pKa = 8.53YY273 pKa = 9.35TGGDD277 pKa = 3.01HH278 pKa = 6.95TYY280 pKa = 9.94IIEE283 pKa = 4.11SRR285 pKa = 11.84SINEE289 pKa = 3.85MVVRR293 pKa = 11.84TTDD296 pKa = 3.2GNGEE300 pKa = 4.08FDD302 pKa = 3.02WGFILIADD310 pKa = 4.13EE311 pKa = 4.21
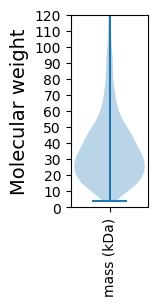
Molecular weight: 33.71 kDa
Isoelectric point according different methods:
Protein with the highest isoelectric point:
>tr|A0A265US35|A0A265US35_9FLAO Alpha/beta hydrolase OS=Winogradskyella aurantia OX=1915063 GN=CA834_10740 PE=4 SV=1
MM1 pKa = 7.69SKK3 pKa = 9.01RR4 pKa = 11.84TFQPSKK10 pKa = 9.13RR11 pKa = 11.84KK12 pKa = 9.48RR13 pKa = 11.84RR14 pKa = 11.84NKK16 pKa = 9.49HH17 pKa = 3.94GFRR20 pKa = 11.84EE21 pKa = 4.18RR22 pKa = 11.84MASVNGRR29 pKa = 11.84KK30 pKa = 9.21VLARR34 pKa = 11.84RR35 pKa = 11.84RR36 pKa = 11.84AKK38 pKa = 9.76GRR40 pKa = 11.84KK41 pKa = 7.91RR42 pKa = 11.84LSVSSEE48 pKa = 3.58ARR50 pKa = 11.84HH51 pKa = 5.78KK52 pKa = 10.72KK53 pKa = 9.83
MM1 pKa = 7.69SKK3 pKa = 9.01RR4 pKa = 11.84TFQPSKK10 pKa = 9.13RR11 pKa = 11.84KK12 pKa = 9.48RR13 pKa = 11.84RR14 pKa = 11.84NKK16 pKa = 9.49HH17 pKa = 3.94GFRR20 pKa = 11.84EE21 pKa = 4.18RR22 pKa = 11.84MASVNGRR29 pKa = 11.84KK30 pKa = 9.21VLARR34 pKa = 11.84RR35 pKa = 11.84RR36 pKa = 11.84AKK38 pKa = 9.76GRR40 pKa = 11.84KK41 pKa = 7.91RR42 pKa = 11.84LSVSSEE48 pKa = 3.58ARR50 pKa = 11.84HH51 pKa = 5.78KK52 pKa = 10.72KK53 pKa = 9.83
Molecular weight: 6.35 kDa
Isoelectric point according different methods:
Peptides (in silico digests for buttom-up proteomics)
Below you can find in silico digests of the whole proteome with Trypsin, Chymotrypsin, Trypsin+LysC, LysN, ArgC proteases suitable for different mass spec machines.| Try ESI |
 |
|---|
| ChTry ESI |
 |
|---|
| ArgC ESI |
 |
|---|
| LysN ESI |
 |
|---|
| TryLysC ESI |
 |
|---|
| Try MALDI |
 |
|---|
| ChTry MALDI |
 |
|---|
| ArgC MALDI |
 |
|---|
| LysN MALDI |
 |
|---|
| TryLysC MALDI |
 |
|---|
| Try LTQ |
 |
|---|
| ChTry LTQ |
 |
|---|
| ArgC LTQ |
 |
|---|
| LysN LTQ |
 |
|---|
| TryLysC LTQ |
 |
|---|
| Try MSlow |
 |
|---|
| ChTry MSlow |
 |
|---|
| ArgC MSlow |
 |
|---|
| LysN MSlow |
 |
|---|
| TryLysC MSlow |
 |
|---|
| Try MShigh |
 |
|---|
| ChTry MShigh |
 |
|---|
| ArgC MShigh |
 |
|---|
| LysN MShigh |
 |
|---|
| TryLysC MShigh |
 |
|---|
General Statistics
Number of major isoforms |
Number of additional isoforms |
Number of all proteins |
Number of amino acids |
Min. Seq. Length |
Max. Seq. Length |
Avg. Seq. Length |
Avg. Mol. Weight |
|---|---|---|---|---|---|---|---|
0 |
969902 |
31 |
2771 |
339.6 |
38.34 |
Amino acid frequency
Ala |
Cys |
Asp |
Glu |
Phe |
Gly |
His |
Ile |
Lys |
Leu |
|---|---|---|---|---|---|---|---|---|---|
6.403 ± 0.043 | 0.722 ± 0.012 |
5.866 ± 0.043 | 6.504 ± 0.044 |
5.262 ± 0.035 | 6.388 ± 0.049 |
1.803 ± 0.022 | 7.981 ± 0.04 |
7.384 ± 0.066 | 9.465 ± 0.049 |
Met |
Asn |
Gln |
Pro |
Arg |
Ser |
Thr |
Val |
Trp |
Tyr |
|---|---|---|---|---|---|---|---|---|---|
2.217 ± 0.026 | 6.019 ± 0.054 |
3.443 ± 0.026 | 3.336 ± 0.025 |
3.672 ± 0.03 | 6.466 ± 0.034 |
5.705 ± 0.041 | 6.23 ± 0.034 |
1.071 ± 0.017 | 4.062 ± 0.026 |
Most of the basic statistics you can see at this page can be downloaded from this CSV file
Proteome-pI is available under Creative Commons Attribution-NoDerivs license, for more details see here
| Reference: Kozlowski LP. Proteome-pI 2.0: Proteome Isoelectric Point Database Update. Nucleic Acids Res. 2021, doi: 10.1093/nar/gkab944 | Contact: Lukasz P. Kozlowski |
