Saccharomonospora viridis (strain ATCC 15386 / DSM 43017 / JCM 3036 / NBRC 12207 / P101)
Taxonomy: cellular organisms; Bacteria; Terrabacteria group; Actinobacteria; Actinomycetia; Pseudonocardiales; Pseudonocardiaceae; Saccharomonospora; Saccharomonospora viridis
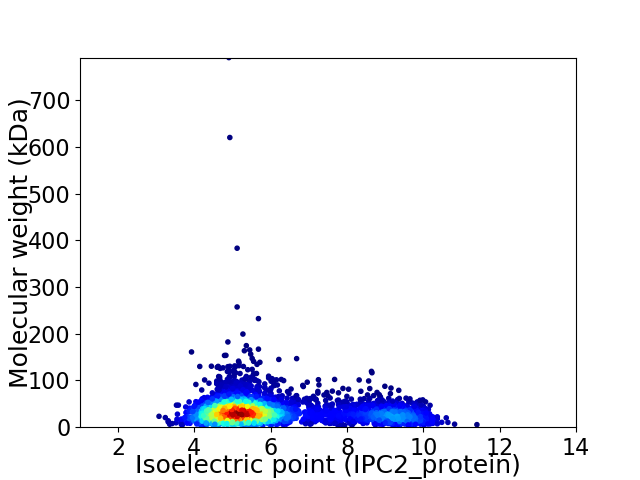
Average proteome isoelectric point is 6.08
Get precalculated fractions of proteins

Virtual 2D-PAGE plot for 3828 proteins (isoelectric point calculated using IPC2_protein)
Get csv file with sequences according to given criteria:
* You can choose from 21 different methods for calculating isoelectric point
Summary statistics related to proteome-wise predictions


Protein with the lowest isoelectric point:
>tr|C7MWE0|C7MWE0_SACVD Uncharacterized protein OS=Saccharomonospora viridis (strain ATCC 15386 / DSM 43017 / JCM 3036 / NBRC 12207 / P101) OX=471857 GN=Svir_07300 PE=4 SV=1
MM1 pKa = 7.64IGLCAALFSLWLAPAGASPGTGDD24 pKa = 4.26AVSTSAQRR32 pKa = 11.84PAQQQVLTWTADD44 pKa = 3.27DD45 pKa = 5.36RR46 pKa = 11.84MDD48 pKa = 4.1EE49 pKa = 4.34YY50 pKa = 11.74ASAPATAKK58 pKa = 10.13PGPATIVFEE67 pKa = 4.22NSEE70 pKa = 4.26NTGNTSGMSHH80 pKa = 6.96TLTFDD85 pKa = 3.31TSSPEE90 pKa = 3.99YY91 pKa = 11.17NNDD94 pKa = 2.92VQLNIVASPFDD105 pKa = 4.19ANGGRR110 pKa = 11.84YY111 pKa = 7.68EE112 pKa = 4.23VEE114 pKa = 4.19VTLSPGKK121 pKa = 10.13YY122 pKa = 8.78RR123 pKa = 11.84YY124 pKa = 8.66YY125 pKa = 10.61CAIPGHH131 pKa = 6.45GEE133 pKa = 3.8MQGVLVVTEE142 pKa = 4.45DD143 pKa = 3.38GGGEE147 pKa = 4.32EE148 pKa = 4.9DD149 pKa = 3.58TTPPEE154 pKa = 3.8VTAEE158 pKa = 4.06VTGDD162 pKa = 3.15QDD164 pKa = 4.45EE165 pKa = 4.4EE166 pKa = 4.55GNYY169 pKa = 9.69IGSATVKK176 pKa = 10.35ISAQDD181 pKa = 3.22SGSGVDD187 pKa = 3.44TVEE190 pKa = 4.01YY191 pKa = 10.83DD192 pKa = 3.17LDD194 pKa = 3.8EE195 pKa = 6.51AGFEE199 pKa = 4.72PYY201 pKa = 9.73TEE203 pKa = 4.37PLTINEE209 pKa = 4.67PGDD212 pKa = 3.56HH213 pKa = 5.49TVHH216 pKa = 6.59YY217 pKa = 9.78RR218 pKa = 11.84ATDD221 pKa = 3.41NAGNTSEE228 pKa = 4.24TGSVTFTVVEE238 pKa = 4.45GDD240 pKa = 4.03TEE242 pKa = 4.41DD243 pKa = 3.51TTPPEE248 pKa = 3.88VTAEE252 pKa = 4.06VTGDD256 pKa = 3.15QDD258 pKa = 4.45EE259 pKa = 4.4EE260 pKa = 4.55GNYY263 pKa = 9.69IGSATVKK270 pKa = 10.35ISAQDD275 pKa = 3.22SGSGVDD281 pKa = 3.44TVEE284 pKa = 4.01YY285 pKa = 10.83DD286 pKa = 3.17LDD288 pKa = 3.8EE289 pKa = 6.51AGFEE293 pKa = 4.72PYY295 pKa = 9.73TEE297 pKa = 4.37PLTINEE303 pKa = 4.67PGDD306 pKa = 3.56HH307 pKa = 5.49TVHH310 pKa = 6.59YY311 pKa = 9.78RR312 pKa = 11.84ATDD315 pKa = 3.41NAGNTSEE322 pKa = 4.24TGSVTFTVVEE332 pKa = 4.45GDD334 pKa = 4.03TEE336 pKa = 4.41DD337 pKa = 3.51TTPPEE342 pKa = 3.98VTVQLTGSQDD352 pKa = 3.53AQWNYY357 pKa = 10.25VDD359 pKa = 3.94SATVALSAHH368 pKa = 6.68DD369 pKa = 4.53PDD371 pKa = 4.94SGVHH375 pKa = 5.49FLRR378 pKa = 11.84YY379 pKa = 9.83SLDD382 pKa = 3.59GGSYY386 pKa = 8.24TAYY389 pKa = 10.53GEE391 pKa = 4.32PIVVNEE397 pKa = 4.28PGEE400 pKa = 4.34HH401 pKa = 4.72TVLYY405 pKa = 10.18HH406 pKa = 7.21AVDD409 pKa = 3.34HH410 pKa = 6.59AGNRR414 pKa = 11.84SEE416 pKa = 4.35DD417 pKa = 3.49GKK419 pKa = 9.78VTFTVVVAEE428 pKa = 4.67GDD430 pKa = 3.38ACPASDD436 pKa = 4.55IRR438 pKa = 11.84DD439 pKa = 3.58TLVIKK444 pKa = 10.71GHH446 pKa = 7.22DD447 pKa = 3.55STVANVDD454 pKa = 3.44TGNGCTLNDD463 pKa = 5.35LIDD466 pKa = 3.69EE467 pKa = 4.39HH468 pKa = 9.11AEE470 pKa = 4.05YY471 pKa = 9.98PNQGAFLAHH480 pKa = 4.95VTKK483 pKa = 9.95VTNDD487 pKa = 3.34LVADD491 pKa = 4.43GVISDD496 pKa = 3.87SEE498 pKa = 3.82QRR500 pKa = 11.84RR501 pKa = 11.84ILRR504 pKa = 11.84AAEE507 pKa = 3.7NSGVGEE513 pKa = 4.1
MM1 pKa = 7.64IGLCAALFSLWLAPAGASPGTGDD24 pKa = 4.26AVSTSAQRR32 pKa = 11.84PAQQQVLTWTADD44 pKa = 3.27DD45 pKa = 5.36RR46 pKa = 11.84MDD48 pKa = 4.1EE49 pKa = 4.34YY50 pKa = 11.74ASAPATAKK58 pKa = 10.13PGPATIVFEE67 pKa = 4.22NSEE70 pKa = 4.26NTGNTSGMSHH80 pKa = 6.96TLTFDD85 pKa = 3.31TSSPEE90 pKa = 3.99YY91 pKa = 11.17NNDD94 pKa = 2.92VQLNIVASPFDD105 pKa = 4.19ANGGRR110 pKa = 11.84YY111 pKa = 7.68EE112 pKa = 4.23VEE114 pKa = 4.19VTLSPGKK121 pKa = 10.13YY122 pKa = 8.78RR123 pKa = 11.84YY124 pKa = 8.66YY125 pKa = 10.61CAIPGHH131 pKa = 6.45GEE133 pKa = 3.8MQGVLVVTEE142 pKa = 4.45DD143 pKa = 3.38GGGEE147 pKa = 4.32EE148 pKa = 4.9DD149 pKa = 3.58TTPPEE154 pKa = 3.8VTAEE158 pKa = 4.06VTGDD162 pKa = 3.15QDD164 pKa = 4.45EE165 pKa = 4.4EE166 pKa = 4.55GNYY169 pKa = 9.69IGSATVKK176 pKa = 10.35ISAQDD181 pKa = 3.22SGSGVDD187 pKa = 3.44TVEE190 pKa = 4.01YY191 pKa = 10.83DD192 pKa = 3.17LDD194 pKa = 3.8EE195 pKa = 6.51AGFEE199 pKa = 4.72PYY201 pKa = 9.73TEE203 pKa = 4.37PLTINEE209 pKa = 4.67PGDD212 pKa = 3.56HH213 pKa = 5.49TVHH216 pKa = 6.59YY217 pKa = 9.78RR218 pKa = 11.84ATDD221 pKa = 3.41NAGNTSEE228 pKa = 4.24TGSVTFTVVEE238 pKa = 4.45GDD240 pKa = 4.03TEE242 pKa = 4.41DD243 pKa = 3.51TTPPEE248 pKa = 3.88VTAEE252 pKa = 4.06VTGDD256 pKa = 3.15QDD258 pKa = 4.45EE259 pKa = 4.4EE260 pKa = 4.55GNYY263 pKa = 9.69IGSATVKK270 pKa = 10.35ISAQDD275 pKa = 3.22SGSGVDD281 pKa = 3.44TVEE284 pKa = 4.01YY285 pKa = 10.83DD286 pKa = 3.17LDD288 pKa = 3.8EE289 pKa = 6.51AGFEE293 pKa = 4.72PYY295 pKa = 9.73TEE297 pKa = 4.37PLTINEE303 pKa = 4.67PGDD306 pKa = 3.56HH307 pKa = 5.49TVHH310 pKa = 6.59YY311 pKa = 9.78RR312 pKa = 11.84ATDD315 pKa = 3.41NAGNTSEE322 pKa = 4.24TGSVTFTVVEE332 pKa = 4.45GDD334 pKa = 4.03TEE336 pKa = 4.41DD337 pKa = 3.51TTPPEE342 pKa = 3.98VTVQLTGSQDD352 pKa = 3.53AQWNYY357 pKa = 10.25VDD359 pKa = 3.94SATVALSAHH368 pKa = 6.68DD369 pKa = 4.53PDD371 pKa = 4.94SGVHH375 pKa = 5.49FLRR378 pKa = 11.84YY379 pKa = 9.83SLDD382 pKa = 3.59GGSYY386 pKa = 8.24TAYY389 pKa = 10.53GEE391 pKa = 4.32PIVVNEE397 pKa = 4.28PGEE400 pKa = 4.34HH401 pKa = 4.72TVLYY405 pKa = 10.18HH406 pKa = 7.21AVDD409 pKa = 3.34HH410 pKa = 6.59AGNRR414 pKa = 11.84SEE416 pKa = 4.35DD417 pKa = 3.49GKK419 pKa = 9.78VTFTVVVAEE428 pKa = 4.67GDD430 pKa = 3.38ACPASDD436 pKa = 4.55IRR438 pKa = 11.84DD439 pKa = 3.58TLVIKK444 pKa = 10.71GHH446 pKa = 7.22DD447 pKa = 3.55STVANVDD454 pKa = 3.44TGNGCTLNDD463 pKa = 5.35LIDD466 pKa = 3.69EE467 pKa = 4.39HH468 pKa = 9.11AEE470 pKa = 4.05YY471 pKa = 9.98PNQGAFLAHH480 pKa = 4.95VTKK483 pKa = 9.95VTNDD487 pKa = 3.34LVADD491 pKa = 4.43GVISDD496 pKa = 3.87SEE498 pKa = 3.82QRR500 pKa = 11.84RR501 pKa = 11.84ILRR504 pKa = 11.84AAEE507 pKa = 3.7NSGVGEE513 pKa = 4.1
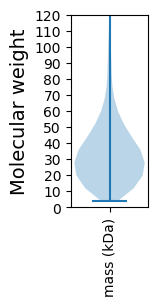
Molecular weight: 54.09 kDa
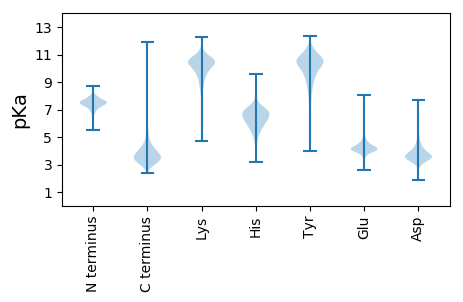
Isoelectric point according different methods:
Protein with the highest isoelectric point:
>tr|C7MSR6|C7MSR6_SACVD Uncharacterized protein OS=Saccharomonospora viridis (strain ATCC 15386 / DSM 43017 / JCM 3036 / NBRC 12207 / P101) OX=471857 GN=Svir_01940 PE=4 SV=1
MM1 pKa = 7.69SKK3 pKa = 9.0RR4 pKa = 11.84TFQPNNRR11 pKa = 11.84RR12 pKa = 11.84RR13 pKa = 11.84ARR15 pKa = 11.84THH17 pKa = 5.69GFRR20 pKa = 11.84LRR22 pKa = 11.84MRR24 pKa = 11.84TRR26 pKa = 11.84AGRR29 pKa = 11.84AILSARR35 pKa = 11.84RR36 pKa = 11.84RR37 pKa = 11.84KK38 pKa = 9.24GRR40 pKa = 11.84RR41 pKa = 11.84RR42 pKa = 11.84LSVV45 pKa = 2.85
MM1 pKa = 7.69SKK3 pKa = 9.0RR4 pKa = 11.84TFQPNNRR11 pKa = 11.84RR12 pKa = 11.84RR13 pKa = 11.84ARR15 pKa = 11.84THH17 pKa = 5.69GFRR20 pKa = 11.84LRR22 pKa = 11.84MRR24 pKa = 11.84TRR26 pKa = 11.84AGRR29 pKa = 11.84AILSARR35 pKa = 11.84RR36 pKa = 11.84RR37 pKa = 11.84KK38 pKa = 9.24GRR40 pKa = 11.84RR41 pKa = 11.84RR42 pKa = 11.84LSVV45 pKa = 2.85
Molecular weight: 5.49 kDa
Isoelectric point according different methods:
Peptides (in silico digests for buttom-up proteomics)
Below you can find in silico digests of the whole proteome with Trypsin, Chymotrypsin, Trypsin+LysC, LysN, ArgC proteases suitable for different mass spec machines.| Try ESI |
 |
|---|
| ChTry ESI |
 |
|---|
| ArgC ESI |
 |
|---|
| LysN ESI |
 |
|---|
| TryLysC ESI |
 |
|---|
| Try MALDI |
 |
|---|
| ChTry MALDI |
 |
|---|
| ArgC MALDI |
 |
|---|
| LysN MALDI |
 |
|---|
| TryLysC MALDI |
 |
|---|
| Try LTQ |
 |
|---|
| ChTry LTQ |
 |
|---|
| ArgC LTQ |
 |
|---|
| LysN LTQ |
 |
|---|
| TryLysC LTQ |
 |
|---|
| Try MSlow |
 |
|---|
| ChTry MSlow |
 |
|---|
| ArgC MSlow |
 |
|---|
| LysN MSlow |
 |
|---|
| TryLysC MSlow |
 |
|---|
| Try MShigh |
 |
|---|
| ChTry MShigh |
 |
|---|
| ArgC MShigh |
 |
|---|
| LysN MShigh |
 |
|---|
| TryLysC MShigh |
 |
|---|
General Statistics
Number of major isoforms |
Number of additional isoforms |
Number of all proteins |
Number of amino acids |
Min. Seq. Length |
Max. Seq. Length |
Avg. Seq. Length |
Avg. Mol. Weight |
|---|---|---|---|---|---|---|---|
0 |
1244168 |
37 |
7310 |
325.0 |
35.1 |
Amino acid frequency
Ala |
Cys |
Asp |
Glu |
Phe |
Gly |
His |
Ile |
Lys |
Leu |
|---|---|---|---|---|---|---|---|---|---|
12.125 ± 0.05 | 0.766 ± 0.011 |
6.226 ± 0.032 | 6.431 ± 0.037 |
2.851 ± 0.027 | 8.841 ± 0.04 |
2.242 ± 0.018 | 3.541 ± 0.03 |
2.168 ± 0.029 | 10.318 ± 0.046 |
Met |
Asn |
Gln |
Pro |
Arg |
Ser |
Thr |
Val |
Trp |
Tyr |
|---|---|---|---|---|---|---|---|---|---|
1.747 ± 0.018 | 1.956 ± 0.02 |
5.785 ± 0.032 | 2.698 ± 0.022 |
8.06 ± 0.05 | 5.338 ± 0.027 |
6.124 ± 0.027 | 9.259 ± 0.039 |
1.449 ± 0.015 | 2.076 ± 0.021 |
Most of the basic statistics you can see at this page can be downloaded from this CSV file
Proteome-pI is available under Creative Commons Attribution-NoDerivs license, for more details see here
| Reference: Kozlowski LP. Proteome-pI 2.0: Proteome Isoelectric Point Database Update. Nucleic Acids Res. 2021, doi: 10.1093/nar/gkab944 | Contact: Lukasz P. Kozlowski |
